Fig. 1
Image
Figure Caption
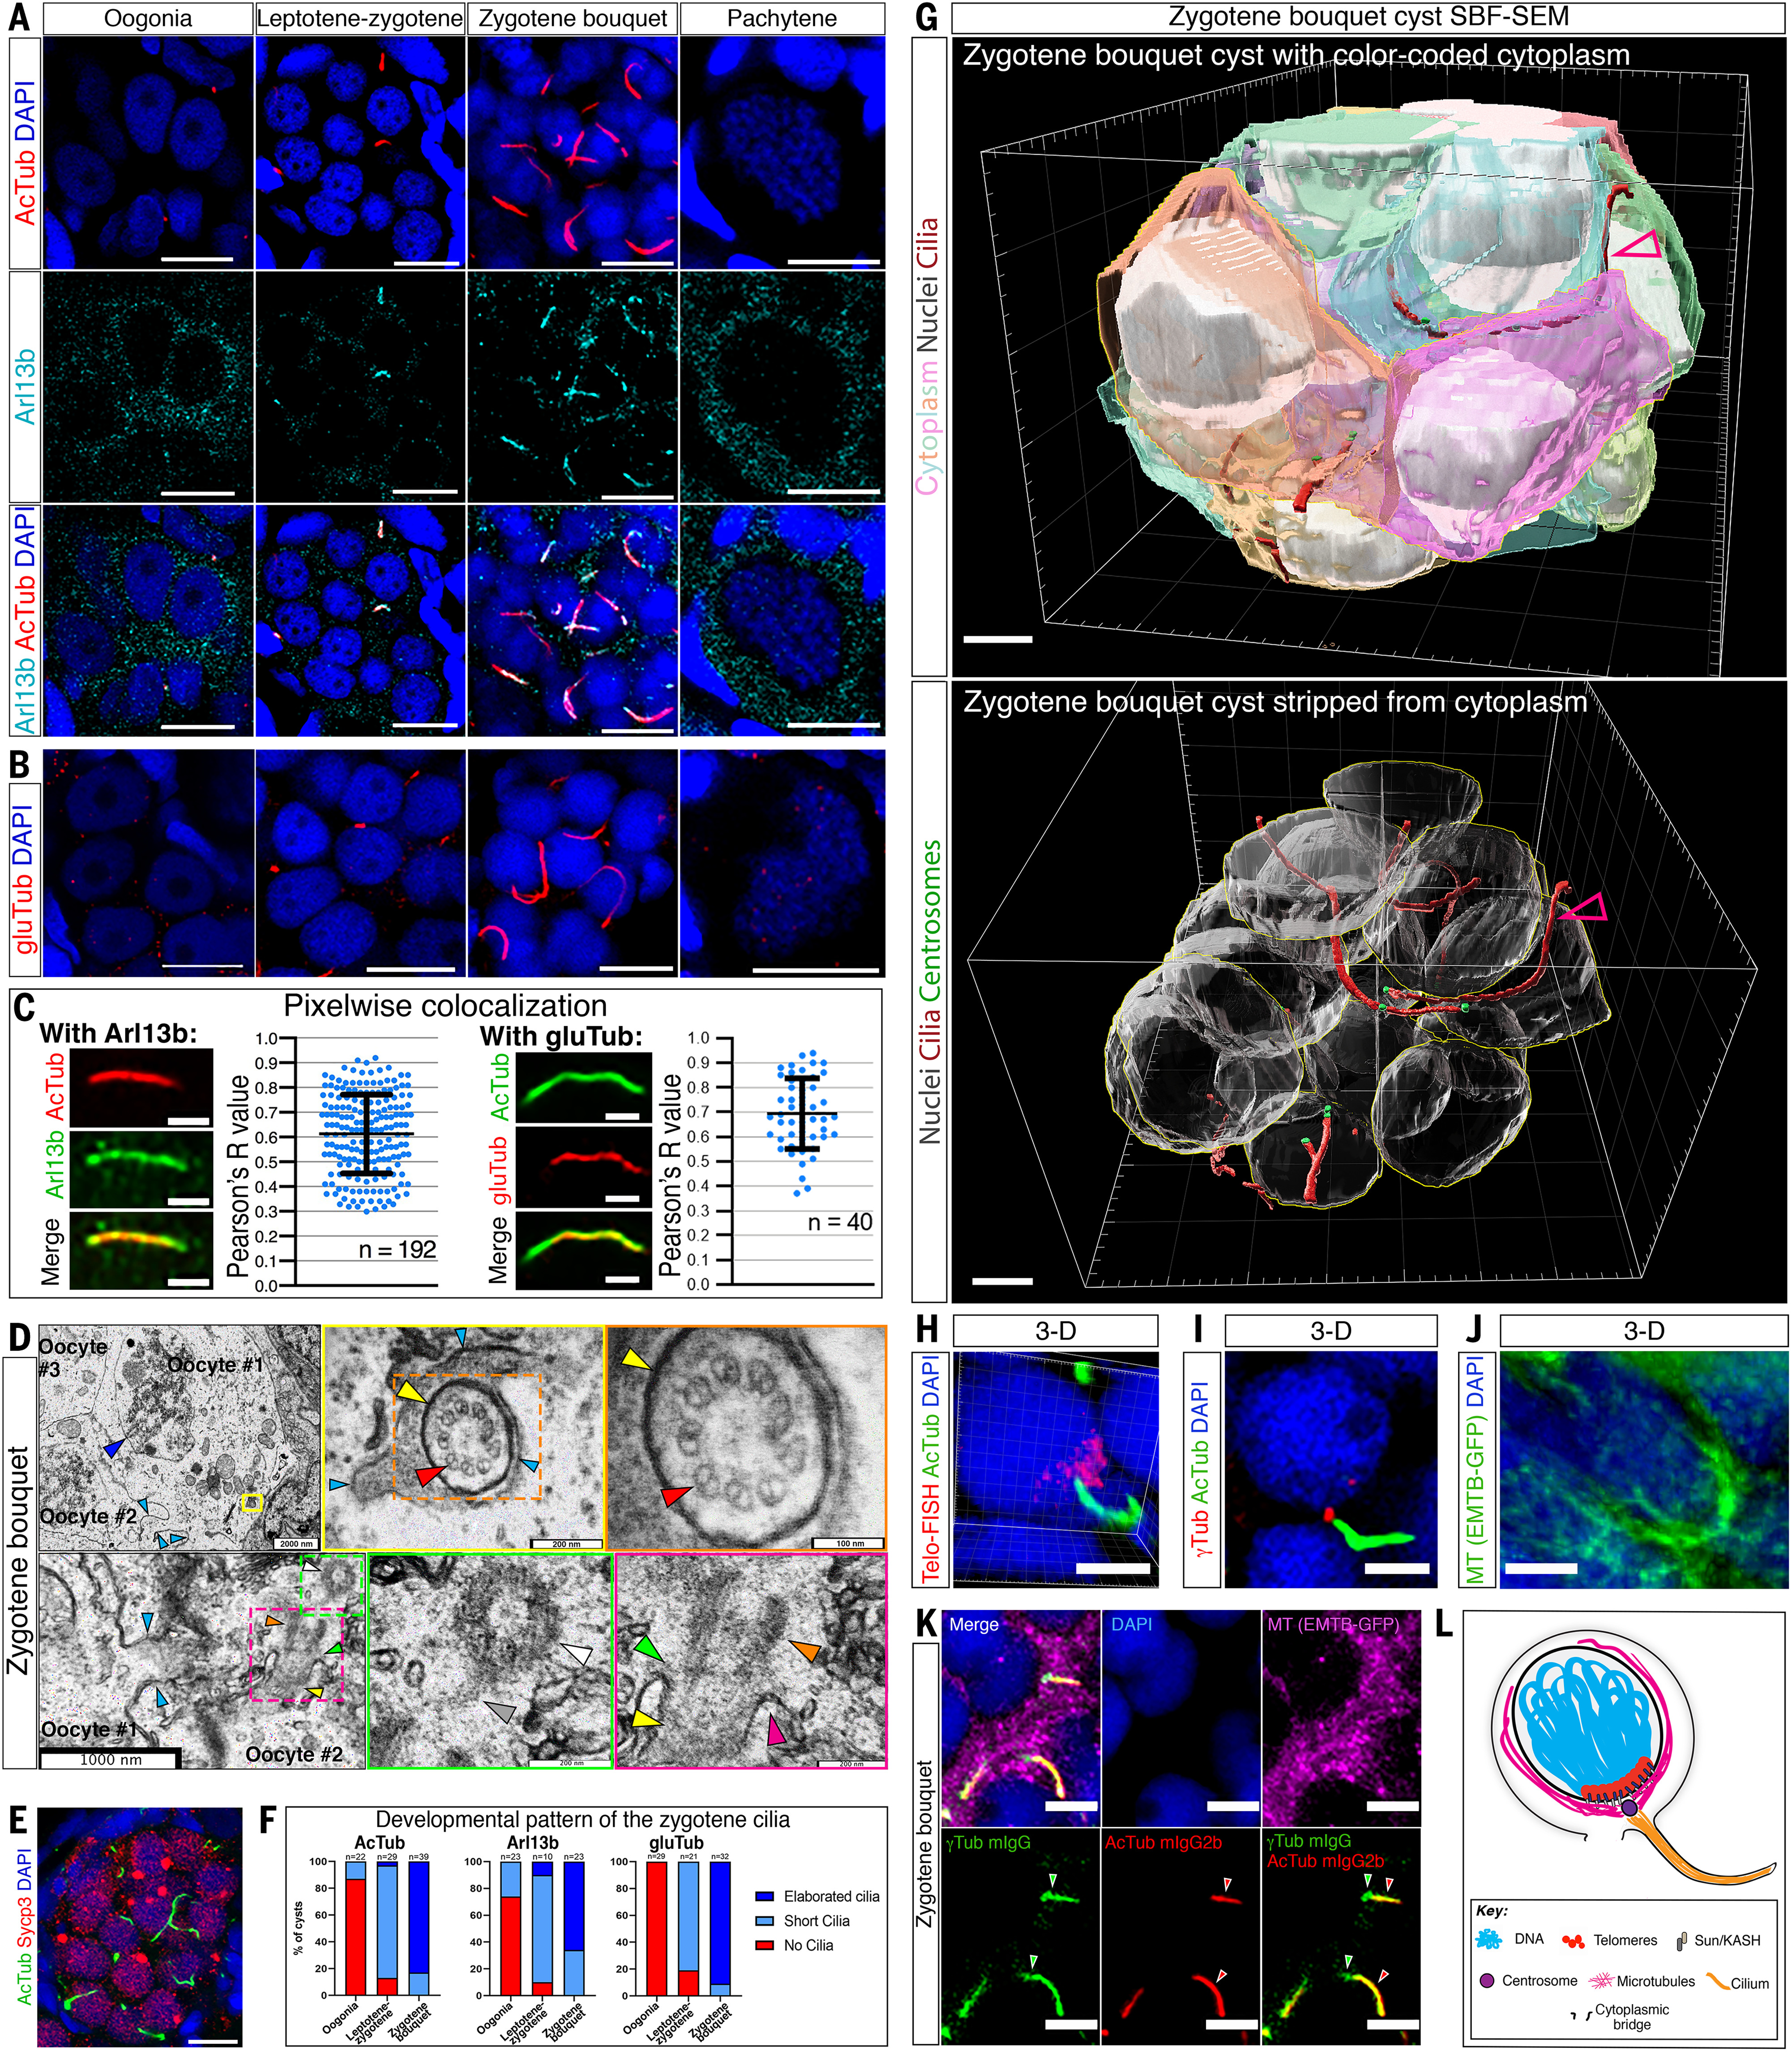
Fig. 1. A zygotene-specific oocyte cilium.
(A) AcTub and Arl13b labeling shown at the indicated stages (n = 28 cysts in n = 8 ovaries). Scale bars for cyst panels, 5 μm. Scale bars for pachytene panels, 10 μm. (B) GluTub labeling shown as in (A) (n = 82 cysts in n = 7 ovaries). Scale bars are as in (A). (C) Pixelwise colocalization test for AcTub and Arl13b and for AcTub and gluTub. n, number of cilia. Bars are mean ± standard deviation (SD). (D) TEM images of cilia in leptotene-zygotene oocytes. Top left panel: leptotene-zygotene oocytes (dark-blue arrowhead indicates presumptive synapsed chromosomes interfacing the NE) within a germline cyst (light-blue arrowheads - cytoplasmic bridges. Right panels show cross-section of a ciliary axoneme, in higher magnifications (color-coded boxes), including ciliary membrane (yellow arrow) and MT doublets (red arrow), between oocyte membranes (light-blue arrowheads). Bottom panels: ciliary structures adjacent to a cytoplasmic bridge (light-blue arrows), including centriole (white), linker (gray), basal body (orange) transition zone (green), ciliary pockets (pink), axoneme (yellow), shown in higher magnifications (color-coded boxes in right panels). Scale bars are indicated. n = 23 oocytes in n = 5 ovaries. (E) AcTub and Sycp3 labeling shown in a zygotene cyst. n = 24 cysts in n = 2 ovaries. Scale bar, 10 μm. (F) The developmental distribution of the zygotene cilia as detected by AcTub (n > 100 ovaries), Arl13b (n = 18 ovaries), and GluTub (n = 11 ovaries). n = number of cysts. (G) 3D rendering of a zygotene bouquet cyst from SBF-SEM data, showing: cytoplasm of cyst oocytes (different transparent colors), nuclei (gray), cilia (maroon; maroon-gray arrowhead), and basal body centrosomes (green). Bottom panel: same cyst render stripped from cytoplasm to show the cilia. Scale bars are 5 μm. (H to J) Zygotene bouquet oocytes from ovaries labeled for (Scale bars are 5 μm): (H) Telomeres (Telo-FISH) and AcTub showing that the cilium emanates from the cytoplasm apposing the telomere cluster. n = 3 ovaries. A snapshot from 3D construction in movie S7. (I) γTub and AcTub showing that the cilium emanates from the centrosome, which was shown to localize apposing the telomere cluster (10). n = 5 ovaries. (J) Microtubules [Tg(βact:EMTB-3XGFP)] showing perinuclear cables (nucleus is counterstained with DAPI). n = 7 ovaries. A snapshot from 3D construction in movie S8. Another example is shown in movie S9. (K) Co-labeling of microtubules (EMTB-GFP), γTub, AcTub, and DAPI, reveals that the zygotene cilium emanate from the centrosome, which is embedded in a perinuclear microtubule network. A merged image and all individual channels are shown. n = 5 ovaries. γTub (mIgG1) and AcTub (mIgG2b) antibodies are both isoforms of mIgG. We used mIgG secondary antibody that binds both primary γTub and AcTuB antibodies, and a mIgG2b secondary antibody that specifically binds to the AcTuB antibody and not γTub antibody (arrowheads in the three bottom panels). (L) Scheme showing the bouquet cytoplasmic cable system.
Acknowledgments
This image is the copyrighted work of the attributed author or publisher, and
ZFIN has permission only to display this image to its users.
Additional permissions should be obtained from the applicable author or publisher of the image.
Full text @ Science

