|
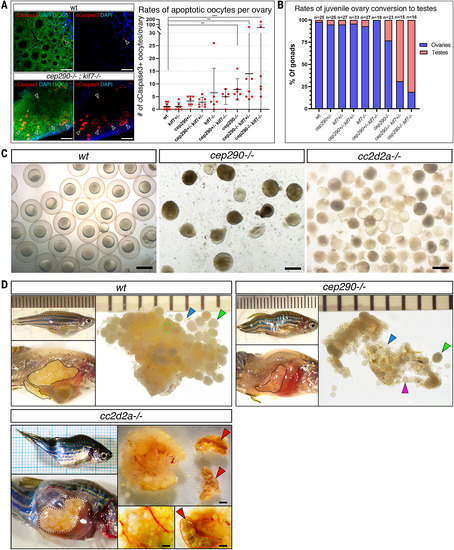
Fig. 5. Ciliary mutants show defective ovarian development and fertility. (A) cCaspase3 apoptosis labeling (white arrowheads) in juvenile ovaries. DiOC6 is a cytoplasmic marker. Scale bars are 50 μm. The number of cCaspase3-positive oocytes per gonad are plotted. Each dot represents a gonad, n = 5 to 10 gonads per genotype. Bars are mean ± SD. (B) Rates of juvenile gonad conversion. n, number of gonads. (C) Images of eggs obtained by squeezing for IVF experiments. Scale bar, 1 mm. (D) Adult females and ovaries showing: ovaries within the peritoneal cavity (black outline), st.III premature oocytes (green arrows and outlines), young transparent st.I oocytes (blue arrows), st.II oocytes (pink arrows) and degenerated tissue masses (red arrow and outline). Ruler graduations and scale bars, 1 mm. Mutant females exhibit scoliosis.
|