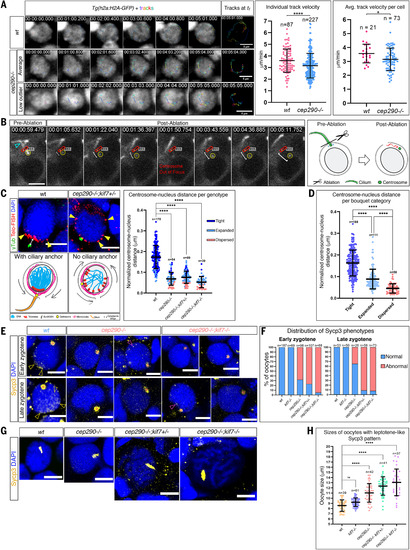
Fig. 3. Centrosome anchoring by the zygotene cilium is required for telomere clustering in bouquet formation and for proper synaptonemal complex formation. (A) Live time-lapse imaging of chromosomal bouquet rotations in Tg(h2a:h2a-gfp);cep290+/+ and sibling Tg(h2a:h2a-gfp);cep290–/– ovaries. Chromosomal tracks and their sum at Tf are shown. Individual track velocities (n, number of tracks) and average track velocity per cell (n, number of cells) are plotted. Oocytes with mean and low outlier (below the SD) values of average track velocities are shown for cep290–/–. Images are snapshots from movie S12. Scale bars, 5 μm. (B) Laser ablation of the zygotene cilium. The targeted cilium (teal arrowhead) is shown “pre-ablation” and the ablation region at its base (S1:1) is indicated throughout the time-lapse. The ablated ciliary associated centrosome (yellow circle) dislocates upon ablation in both XY and Z (“centrosome out of focus”) axes (see cartoon, right). Time is indicated in mili-seconds. Scale bar, 5 μm. n = 17 cilia (oocytes) from n = 11 ovaries. Images are snapshots from movie S13; another example is shown in movie S14. (C) Images of mid-bouquet stage oocytes from wt and cep290–/–;kif7+/– ovaries co-labeled for the centrosome (γTub) and telomeres (Telo-FISH). The distance between the centrosome and the nucleus (white arrow) in the wt is significantly decreased in mutant oocytes with defected telomere clustering (yellow arrowheads); see cartoons below. The normalized distances are plotted and bouquet phenotype categories are color-coded. Scale bar, 5 μm. n, number of oocytes. (D) The normalized centrosome-nucleus distance in oocytes pooled from all genotypes in (C), categorized based on their bouquet phenotype. n, number of oocytes. (E) Images of Sycp3 localization patterns in early and late zygotene stages. Note normal Sycp3 patterns in wt oocytes (yellow arrowheads) and their absence in mutant oocytes (scattered foci, magenta arrowheads). Sycp3 signal accumulates in nucleoli (empty red circle) in all wt and mutant oocytes. Scale bars, 5 μm. (F) The distribution of normal and abnormal Sycp3 oocytes from (E). n, number of oocytes. (G) Images of “leptotene-like” oocytes shown in scale. Scale bars, 5 μm. (H) “Leptotene -like” oocyte sizes per genotype. n, number of oocytes. Bars are mean ± SD.
|
