|
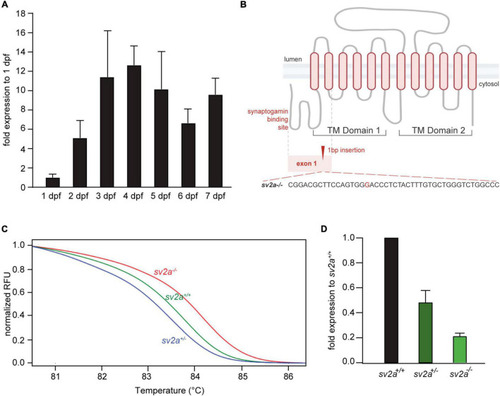
sv2a expression in developing zebrafish larvae (1-7 dpf) and CRISPR-mediated sv2a knockout in zebrafish. (A) qPCR analysis of sv2a mRNA levels in wildtype larvae normalized to 18s and represented as the fold expression to 1 dpf. Values are reported as mean ± SD of three independent experiments. (B) Schematic representation of the SV2A protein with the two distinct transmembrane (TM) domains and the cytosolic synaptogamin binding site. Gray dashed line indicates exon 1 encoding synaptogamin binding domain and the first two TM helices. Red dashed line magnifies the region with the 1 nucleotide insertion (G) at the target site in exon 1. (C) High resolution melting (HRM) curve analysis discriminates sv2a+/+, sv2a+/–, and sv2a–/– zebrafish larvae at 6 dpf. (D) qPCR analysis of sv2a mRNA levels in sv2a+/+, sv2a+/–, and sv2a–/– larvae at 6 dpf normalized to 18s and represented as the fold expression to sv2a+/+ larvae. Values are reported as the mean ± SD of three independent experiments.
|