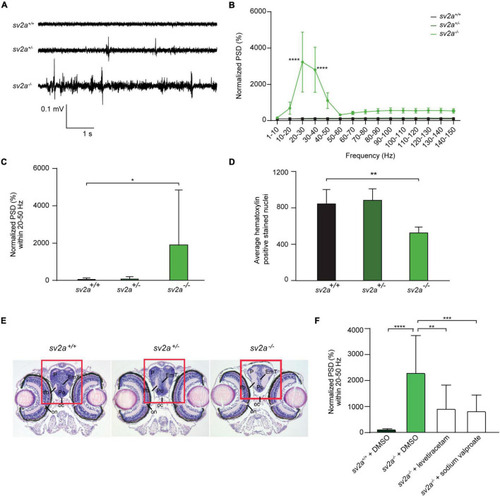
Spontaneous electrographic seizures and brain malformation in sv2a knockout zebrafish. (A) Representative local field potential (LFP) recordings of sv2a+/+, sv2a+/–, and sv2a –/– zebrafish larvae at 6 dpf. (B) Power spectral density (PSD) analysis of sv2a+/+ (n = 9), sv2a+/– (n = 11), and sv2a –/– (n = 10) zebrafish larvae at 6 dpf. A significant increase in PSD values was observed in sv2a–/– larvae compared to sv2a+/+ larvae. Results were normalized to sv2a+/+ larvae as 100%. Statistical analysis was performed using two-way ANOVA with Sidak’s multiple comparisons test (****p < 0.0001 compared to sv2a+/+). (C) PSD values (mean ± SD) plotted per condition over the 20–50 Hz region. Statistical analysis was performed using one-way ANOVA followed by Dunnett’s multiple comparison (*p < 0.05). (D) Hematoxylin-positive stained nuclei (mean ± SD) counted using QuPath (0.1.2) software. The region with significant loss of hematoxylin-positive stained nuclei was highlighted in red. The results are expressed as mean ± SD of 4 equivalent sections per genotype. Statistical analysis was performed using one-way ANOVA followed by Dunnett’s multiple comparison (**p < 0.01). (E) Hematoxylin and eosin staining of paraffin-embedded coronary sections from the forebrain of sv2a+/+, sv2a+/–, and sv2a –/– zebrafish larvae at 6 dpf. Scale bar 100 μm. oc, optic chiasm; on, optic nerve; Po, preoptic region; P, pallium; lfb, lateral forebrain bundle. (F) Effect of levetiracetam and sodium valproate on locomotor behavior and epileptiform brain activity in 6 dpf sv2a–/– zebrafish larvae. PSD values (mean ± SD) from LFP recordings at 6 dpf plotted per condition over the 20-50 Hz region for sv2a+/+ and sv2a–/– larvae after incubation with levetiracetam and valproic acid at their MTC or DMSO control at 5 dpf for 22 h. Number of larvae per condition: n = 9–35. Statistical analysis was performed using ordinary one-way ANOVA. **p < 0.01, ***p < 0.001, ****p < 0.0001.
|
