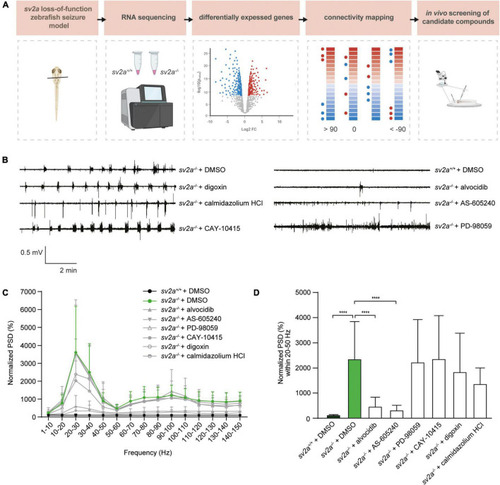
Connectivity mapping in sv2a–/– zebrafish larvae. (A) Overview of the connectivity mapping workflow. Heads of sv2a–/– and sv2a+/+ zebrafish larvae were sampled and RNA was extracted. After RNA sequencing and differential expression analysis, top 50 up- and down-regulated genes in sv2a–/– larvae (compared to sv2a+/+) were selected based on Wald statistic and compared to gene expression profiles of compounds in the CMap database in order to identify compounds reversing the differential expression signature (scores < −90). Three of these compounds (alvocidib, AS-605240, PD-98059) and three negative controls (scores > 90; digoxin, calmidazolium HCl, or equaling zero; CAY-10415) were tested in the sv2a loss-of-function in LFP recordings. (B) Representative LFP recordings of sv2a–/– and sv2a+/+ larvae after incubation with selected CMap compounds at their MTCs or DMSO control at 5 dpf for 22 h. (C) PSD analysis of sv2a–/– and sv2a+/+ larvae after incubation of selected CMap compounds at their MTCs or DMSO control at 5 dpf for 22 h. Results were normalized to sv2a+/+ larvae as 100%. Number of larvae per condition: n = 9–27. (D) Power spectral density (PSD) values (mean ± SD) from LFP recordings at 6 dpf plotted per condition over the 20-50 Hz region for sv2a–/– and sv2a+/+ larvae after incubation of selected CMap compounds at their MTCs or DMSO control at 5 dpf for 22 h. Number of larvae per condition: n = 9–27. Data are presented as mean ± SD. Statistical analysis was performed using ordinary one-way ANOVA. ***p < 0.001, ****p < 0.0001.
|
