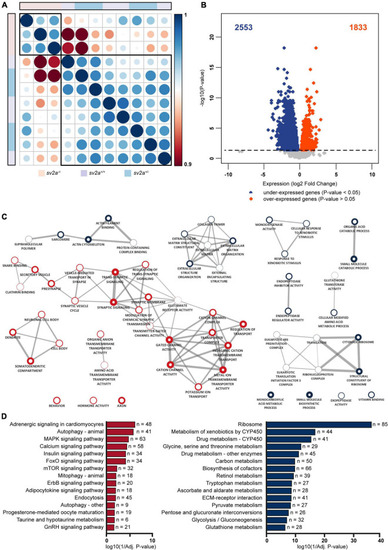
Transcriptome analysis and gene ontology (GO) enrichment map of sv2a–/– larvae. (A) Spearman’s rank correlation matrix of the RNA-Seq data showing separate clustering of sv2a–/– samples from sv2a+/+ and sv2a+/– samples. Scale bar indicates the strength of the correlation, with 1 indicating a strong positive correlation (dark blue) and 0.9 indicating weak correlation (dark red) between samples. Areas of the circles show absolute values of corresponding correlation coefficients. Samples of different genotypes are indicated in distinct colors codes. (B) Volcano plot showing the differentially expressed genes (DEG) (padj < 0.05) between sv2a–/– and sv2a+/+ larvae. Of the 4386 DEGs, 2553 were found to be down- (blue) and 1833 to be up-regulated (red) in sv2a–/– larvae compared to sv2a+/+. (C) GO enrichment map from up- and down-regulated genes between sv2a+/+ and sv2a–/– zebrafish larvae. Each node represents a different GO term, the red and blue outside of nodes indicate enrichment in up- or down-regulated genes, respectively. The larger the node the greater the number of genes in the enriched GO term. Connecting lines indicate common genes shared between nodes, the thicker the line the more genes in common. (D) Enriched pathways from differentially expressed genes between sv2a–/– and sv2a+/+ zebrafish larvae. Pathways enriched amongst up-regulated genes are indicated in red, pathways enriched amongst down-regulated genes are indicated in blue. The x-axis represents the log10 (1/p-value), n indicates the number of genes appearing in each category.
|
