
Fig. 4
- ID
- ZDB-FIG-211006-4
- Publication
- Leach et al., 2021 - The immune response is a critical regulator of zebrafish retinal pigment epithelium regeneration
- Other Figures
- All Figure Page
- Back to All Figure Page
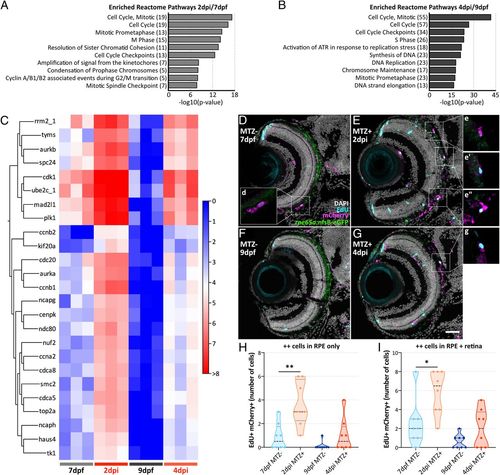
Proliferation signatures are present in macrophages/microglia during RPE regeneration. Top 10 Reactome pathways enriched from groups of significantly up-regulated DEGs at 2 dpi/7 dpf (A) and 4 dpi/9 dpf (B) in FACS-isolated mCherry+ MΦs/μglia. Numbers in parentheses indicate quantities of significantly enriched DEGs. (C) Heatmap showing hierarchical clustering of cell cycle– and mitosis-related genes selected for representation based on presence in the top 50 up-regulated gene sets from 2 dpi/7 dpf and 4 dpi/9 dpf DEG analyses (SI Appendix, Tables S7 and S8). Heatmap legend represents log2 (transcripts per million +1). Confocal micrographs of transverse sections from MTZ− and MTZ+ Tg(mpeg1:mCherry; rpe65a:nfsB-eGFP) eyes at 7 dpf/2 dpi (D and E) and 9 dpf/4 dpi (F and G). Digital zooms (D–E” and G) highlight proliferating (EdU+; cyan) mCherry+ MΦs/μglia (magenta). (Scale bar, 40 μm.) (H and I) Violin plots showing significant increases in EdU+ mCherry+ costaining in the RPE (H) and in the RPE and retina (I) of 2 dpi MTZ+ larvae. Dashed black lines represent the median, and dotted black lines represent quartiles. SI Appendix, Table S12 contains statistical information. Dorsal is up; *P value ≤ 0.05; and **P value ≤ 0.01. |