
Fig. 3
- ID
- ZDB-FIG-211006-3
- Publication
- Leach et al., 2021 - The immune response is a critical regulator of zebrafish retinal pigment epithelium regeneration
- Other Figures
- All Figure Page
- Back to All Figure Page
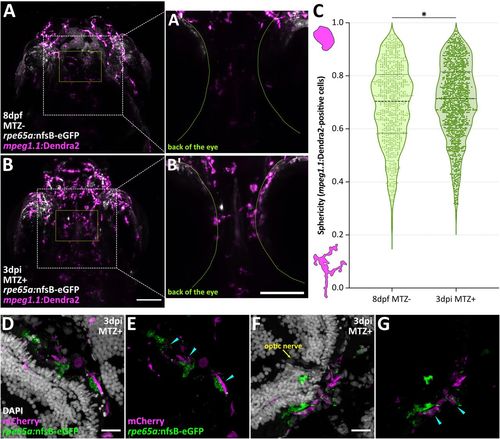
Macrophages/microglia show increased sphericity and association with RPE debris at 3 dpi. In vivo light-sheet micrographs from 8 dpf MTZ− (A and A’) and 3 dpi MTZ+ (B and B’) Tg(mpeg1.1:Dendra2;rpe65a:nfsB-eGFP) larvae. (A’ and B’) Digital zooms of cropped 100 μm z-stacks (z-step = 100 to 200) showing mpeg1.1:Dendra2 (red)+ cell localization (magenta) in/adjacent to the back of the eye (green dashed line). (A and B’) White labels endogenous eGFP. Yellow boxes correspond to areas shown in Movies S2 and S3 (A) and in Movies S5 and S6 (B). Anterior is up. (Scale bars, 100 μm.) (C) Violin plots showing a significant increase in sphericity of anterior mpeg1.1:Dendra2 (red)+ cells in 3 dpi MTZ+ larvae when compared with 8 dpf MTZ− controls. SI Appendix, Table S12 contains statistical information. Dashed black lines represent the median, and dotted black lines represent quartiles; *P value ≤ 0.05. (D–G) Confocal micrographs of transverse sections from 3 dpi MTZ+ Tg(mpeg1:mCherry; rpe65a:nfsB-eGFP) larval eyes. Cyan arrowheads point to MΦs/µglia (magenta) overlapping with RPE debris (green) in central–dorsal (D and E) and central–ventral (F and G) regions. Dorsal is up; anterior is left. (Scale bars, 20 μm.) |