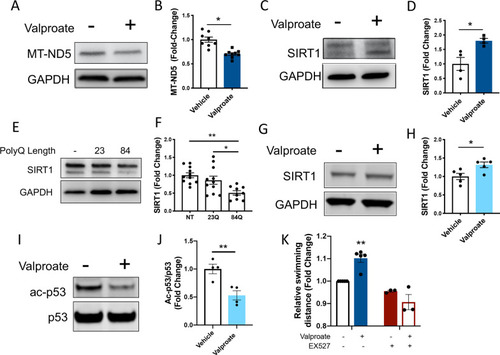
Sodium valproate treatment increases SIRT1 levels and signs of sirtuin activity, validating the increased sirtuin activity predicted by mass spectrometry. A Valproate treatment predicted decreased MTND5 levels from the proteomic analysis. Immunoblot of MTND5 showed valproate treated EGFP-ataxin-3 84Q protein lysates at 6dpf were decreased. B Quantification of MTND5 levels confirmed this finding (*p < 0.001, n = 8–9). C Immunoblots of mutant ataxin-3 zebrafish treated with valproate showed an increase in SIRT1 expression. D Quantification of SIRT1 levels revealed an increase with valproate treatment (*p = 0.015, n = 4). E Immunoblots of 6-day old transgenic MJD zebrafish show levels of SIRT1. F Densitometric analysis revealed decreased levels of SIRT1 in zebrafish expressing ataxin-3 with polyQ expansion compared to wild-type ataxin-3 and non-transgenic fish (p = 0.025 and p = 0.002 respectively, n = 9–11). G Immunoblot analysis of ataxin-3 84Q expressing HEK293 cells treated with valproate revealed that valproate increases SIRT1. H Quantification SIRT1 levels revealed a significant increase in SIRT1 from valproate treatment (p = 0.024, n = 5). I Immunoblot of acetylated p53 and p53, as p53 deacetylation is a marker of sirtuin activity from ataxin-3 84Q expressing HEK293 cells treated with and without valproate. J Quantification of acetylated p53 levels, normalized to p53 levels, revealed that valproate treatment resulted in increased p53 deacetylation (p = 0.008, n = 4). K Whilst treating the EGFP-ataxin-3 84Q zebrafish with valproate resulted in the zebrafish swimming longer distances, co-treatment with valproate and EX527, or EX527 alone (SIRT1 inhibitor), did not result in increased swimming distances (p < 0.002; valproate group significantly greater distances swum than all other groups). Data represents mean ± SEM. All cell culture experiments are of independent experiments. Comparisons between vehicle and valproate treatment were analysed statistically using unpaired student t-tests, comparison between ATXN3 genotypes were analysed using an unpaired one-way ANOVA followed by a Tukey post-hoc analysis and comparison of valproate versus EX527 treated was analysed using a two-way ANOVA followed by Tukey post-hoc analysis
|
