
FIGURE
Fig 3
Fig 3
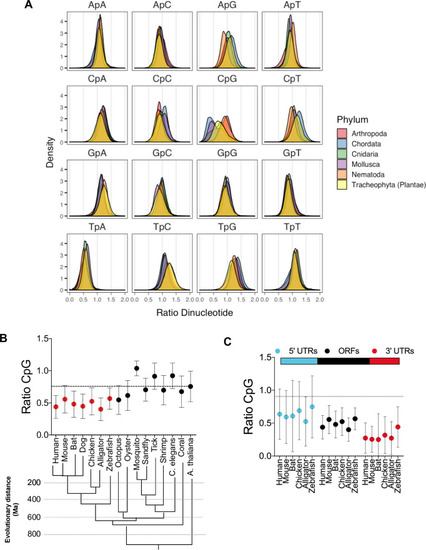
(A) Open reading frames (ORFs) from several organisms belonging to the indicated phyla were collected from the NCBI nucleotide database and dinucleotide frequency ratio (observed/expected) was calculated and frequency distribution for each dinucleotide in ORFs was plotted. (B) Average dinucleotide observed/expected ratio in various animal species. Evolutionary distance (presented in million years, Ma) of indicated species was based on [ |
Expression Data
Expression Detail
Antibody Labeling
Phenotype Data
Phenotype Detail
Acknowledgments
This image is the copyrighted work of the attributed author or publisher, and
ZFIN has permission only to display this image to its users.
Additional permissions should be obtained from the applicable author or publisher of the image.
Full text @ PLoS Pathog.