|
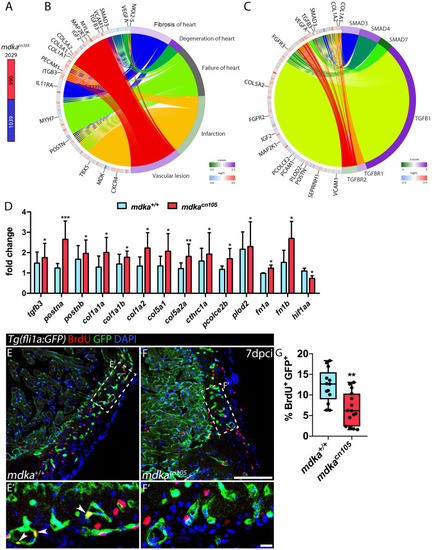
Transcriptional profiling of regenerating mdkacn105 hearts. (A) Total number of differentially expressed genes identified by RNA-seq. Numbers indicate upregulated genes (red) and downregulated genes (blue). (B,C) Circular plots showing representative differentially expressed genes (left semicircle perimeter) and IPA biofunctions and upstream regulators (right semicircle perimeter). Activation z-score scale: green, repression; magenta, activation; white, unchanged. LogFC scale: red, upregulated; blue, downregulated; white, unchanged. (D) qPCR analysis of mdka+/+ and mdkacn105 7 dpci hearts. t-test; *P < 0.05, **P < 0.01, ***P < 0.001; Mean ± SD. (E,F) Immunofluorescence staining of GFP and BrdU in 7 dpci Tg(fli1a:GFP) heart sections. (E′,F′) Higher magnification of the dashed lines in (A,F). Arrowheads indicate proliferating endothelial cells. Scale bar (E,F) 100 μm; (E′,F′) 10 μm. (G) Quantification of BrdU+/GFP+ endothelial cells. nWT = 13, nKO = 15; t-test; **P < 0.01; Mean ± SD.
|