
Figure 3—figure supplement 2.
- ID
- ZDB-FIG-210327-90
- Publication
- Uriu et al., 2021 - From local resynchronization to global pattern recovery in the zebrafish segmentation clock
- Other Figures
-
- Figure 1
- Figure 1—figure supplement 1.
- Figure 2—figure supplement 1.
- Figure 2—figure supplement 1.
- Figure 3—figure supplement 1.
- Figure 3—figure supplement 1.
- Figure 3—figure supplement 2.
- Figure 3—figure supplement 3.
- Figure 3—figure supplement 4.
- Figure 3—figure supplement 5.
- Figure 3—figure supplement 6.
- Figure 3—figure supplement 7.
- Figure 3—figure supplement 8.
- Figure 3—figure supplement 9.
- Figure 3—figure supplement 10.
- Figure 3—figure supplement 11.
- Figure 4
- Figure 4—figure supplement 1.
- Figure 4—figure supplement 2.
- Figure 4—figure supplement 3.
- Figure 4—figure supplement 4.
- Figure 4—figure supplement 5.
- Figure 4—figure supplement 6.
- Figure 4—figure supplement 7.
- Figure 4—figure supplement 8.
- All Figure Page
- Back to All Figure Page
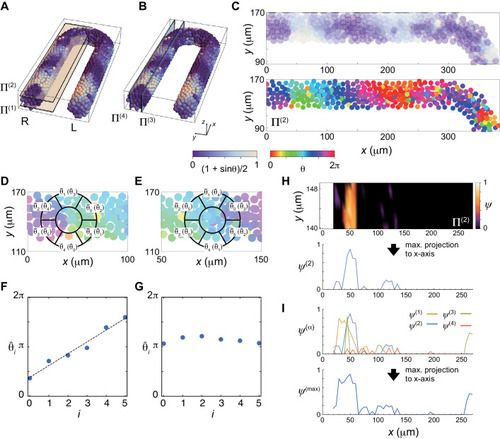
(A), (B) Planes Π(i) for vorticity calculation. Scale bar as in Fig. 2A, indicates the mapping of phase θi to color: white is π/2 and blue is 3π/2. (C) Phase distribution in Π(2) of the right PSM, (top) phase is color coded as in (A, B) and (bottom) color coded as indicated in the color bar. (D), (E) Average phase θ̄k of the subdomain Vk of a ring located at a lattice point. θˆi is the permutation of θ̄k. A phase vortex is present in the region shown in (D), whereas there is no vortex in (E). (F) Linear increase of the values of θˆi along the perimeter of the ring shown in (D). The black line indicates a linear fit to the data points. The vorticity is defined as (θ̂5−θ̂0)/2π. (G) If there is no phase vortex as shown in (E), θˆi does not increase linearly. (H) (top) Spatial distribution of the vorticity in Π(2). (bottom) The vorticity is projected to x-axis as ψ(2). (I) Maximum projection of ψ(i) obtained in each plain Π(i) to x-axis. |