
Figure 3—figure supplement 1.
- ID
- ZDB-FIG-210327-89
- Publication
- Uriu et al., 2021 - From local resynchronization to global pattern recovery in the zebrafish segmentation clock
- Other Figures
-
- Figure 1
- Figure 1—figure supplement 1.
- Figure 2—figure supplement 1.
- Figure 2—figure supplement 1.
- Figure 3—figure supplement 1.
- Figure 3—figure supplement 1.
- Figure 3—figure supplement 2.
- Figure 3—figure supplement 3.
- Figure 3—figure supplement 4.
- Figure 3—figure supplement 5.
- Figure 3—figure supplement 6.
- Figure 3—figure supplement 7.
- Figure 3—figure supplement 8.
- Figure 3—figure supplement 9.
- Figure 3—figure supplement 10.
- Figure 3—figure supplement 11.
- Figure 4
- Figure 4—figure supplement 1.
- Figure 4—figure supplement 2.
- Figure 4—figure supplement 3.
- Figure 4—figure supplement 4.
- Figure 4—figure supplement 5.
- Figure 4—figure supplement 6.
- Figure 4—figure supplement 7.
- Figure 4—figure supplement 8.
- All Figure Page
- Back to All Figure Page
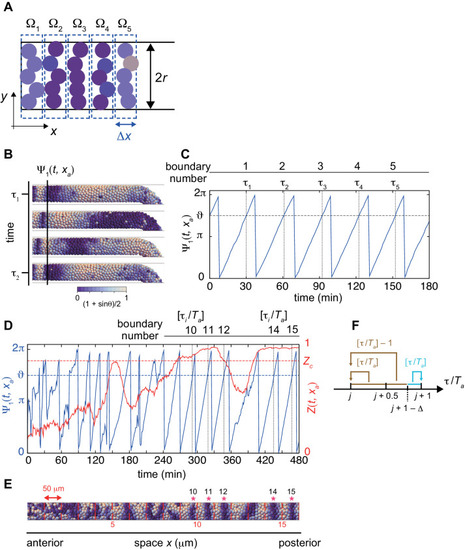
(A) Calculation of local phase order. Kuramoto phase order parameter Zm in each domain Ωm (m = 1, 2,. . 5) are first calculated. The average over these domains is defined as a local phase order. Colored circles indicate cells. The width of the domain Δx is equal to the cell diameter dc, Δx=dc and 5Δx is approximately one segment size. (B) Detection of a segment boundary position by the mean phase at the position xa. Scale bar as in Figure 2A, indicates the mapping of phase θi to color: white is π/2 and blue is 3π/2, also in (E). (C) Time series of the mean phase at the position xa. When the value of mean phase becomes ϑ, a segment boundary is considered to be formed. τi indicates times at which segment boundaries are formed. In (B) and (C), a simulation was started from a synchronized initial condition for illustration. (D) Time series of the mean phase (blue) and local phase order (red) at the position xa. The red dotted line indicates the threshold for the local phase order to determine normal boundaries. τi indicates time when the value of the mean phase surpasses ϑ. Ta is the period of oscillation at the position xa. (E) Formed segment boundaries. The asterisks indicate normal segment boundaries. The red vertical lines indicate expected segment boundary positions. (F) Assignment of segment boundary number. See Materials and methods for details. |