
Figure 2—figure supplement 1.
- ID
- ZDB-FIG-210327-86
- Publication
- Uriu et al., 2021 - From local resynchronization to global pattern recovery in the zebrafish segmentation clock
- Other Figures
-
- Figure 1
- Figure 1—figure supplement 1.
- Figure 2—figure supplement 1.
- Figure 2—figure supplement 1.
- Figure 3—figure supplement 1.
- Figure 3—figure supplement 1.
- Figure 3—figure supplement 2.
- Figure 3—figure supplement 3.
- Figure 3—figure supplement 4.
- Figure 3—figure supplement 5.
- Figure 3—figure supplement 6.
- Figure 3—figure supplement 7.
- Figure 3—figure supplement 8.
- Figure 3—figure supplement 9.
- Figure 3—figure supplement 10.
- Figure 3—figure supplement 11.
- Figure 4
- Figure 4—figure supplement 1.
- Figure 4—figure supplement 2.
- Figure 4—figure supplement 3.
- Figure 4—figure supplement 4.
- Figure 4—figure supplement 5.
- Figure 4—figure supplement 6.
- Figure 4—figure supplement 7.
- Figure 4—figure supplement 8.
- All Figure Page
- Back to All Figure Page
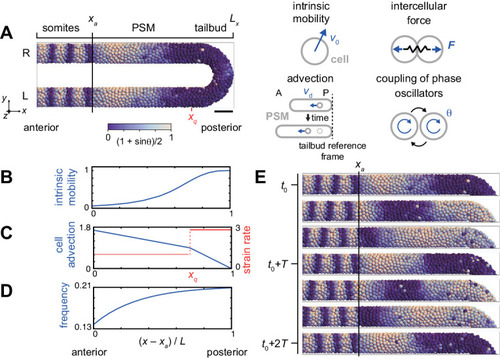
(A) U-shape geometry of the PSM and tailbud (left), and schematics of key ingredients in the model (right). Each sphere represents a PSM cell. The scale bar indicates the mapping of phase θi to color: white is π/2 and blue is 3π/2. R: right. L: left. Scale bar: 50 μm. (B) Intrinsic cell mobility gradient, (C) cell advection speed, and (D) autonomous frequency gradient along the anterior-posterior axis of the PSM and tailbud. In (C), the absolute value of the spatial derivative of advection speed, referred to as strain rate, is indicated by the red line. L is the length of the PSM L = Lx – xa. (E) Kinematic phase waves moving from the posterior to anterior PSM in a simulation. Snapshots of the right PSM are shown. See also Figure 2—video 1. t0 = 302 min is a reference time point. T = 30 min is the period of oscillation at the posterior tip of the tailbud. Parameter values for simulations are listed in Supplementary file 1. |