
FIGURE
Figure 6
- ID
- ZDB-FIG-210301-132
- Publication
- Cuomo et al., 2021 - DNA Methylation Profiles of Tph1A and BDNF in Gut and Brain of L. Rhamnosus-Treated Zebrafish
- Other Figures
- All Figure Page
- Back to All Figure Page
Figure 6
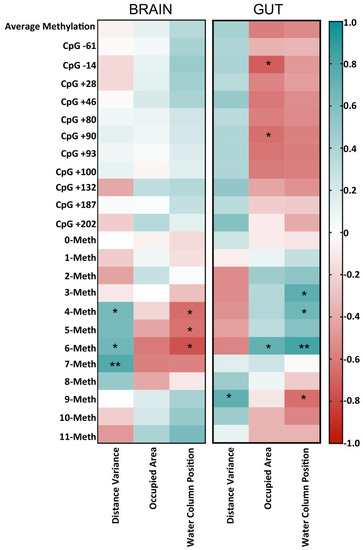
Correlogram showing Pearson correlation between DNA methylation data and behavioral parameters. The graph reports r values derived from Pearson correlation between average methylation, single-CpG methylation, epiallele classes and distance variance, occupied area and water column positions. The scale color from blue to red indicates a positive to negative correlation (−1 ≤ r ≥ 1). Statistical analyses were performed using a Pearson correlation test (* p ≤ 0.05; ** p ≤ 0.01). |
Expression Data
Expression Detail
Antibody Labeling
Phenotype Data
Phenotype Detail
Acknowledgments
This image is the copyrighted work of the attributed author or publisher, and
ZFIN has permission only to display this image to its users.
Additional permissions should be obtained from the applicable author or publisher of the image.
Full text @ Biomolecules