
Figure 2
- ID
- ZDB-FIG-210301-128
- Publication
- Cuomo et al., 2021 - DNA Methylation Profiles of Tph1A and BDNF in Gut and Brain of L. Rhamnosus-Treated Zebrafish
- Other Figures
- All Figure Page
- Back to All Figure Page
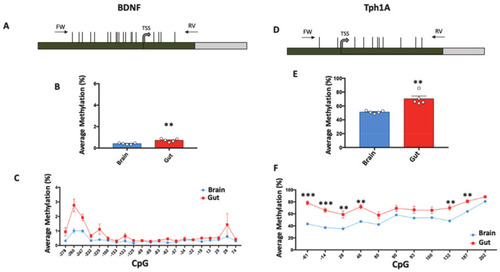
Tissue-specific DNA methylation of BDNF and Tph1A in gut and brain. (A) BDNF promoter region structure showing the position of analyzed CpGs (Horizontal black lines). The numbers of the CpG sites refer to the putative transcriptional start site (TSS), indicated with +1. Green box and gray box indicate promoter and the first intron, respectively. Positions of primers (FW: Forward; RV: Reverse) used for amplification procedure are reported. The BDNF sequence was retrieved by Ensembl with the following accession number: ENSDARG00000018817. (B) BDNF average methylation (%) in brain (Blue Box) and gut (Red Box) of untreated Zebrafishes is reported and indicated as the mean ± standard error of five samples. (C) Average methylation at single CpG site (%) at the BDNF promoter region in brain and gut is reported with blue and red lines, respectively, and indicated as the mean ± standard error of five samples. (D) Tph1A promoter region structure showing the position of the analyzed CpGs with numbers referring to the putative transcriptional start site (TSS). Green and gray boxes indicate promoter and the first intron, respectively. Black arrows at the top of the map specify the position of the primers used for bisulfite amplification. The Tph1A sequence was retrieved by Ensembl with the following accession number: ENSDARG00000029432. (E) Average methylation (%) at Tph1A in gut and brain of five control Zebrafishes. (F) Methylation level at single-CpG sites (%) in the Tph1A analyzed region. Comparison between brain and gut for both Tph1A and BDNF was performed using Student t-test (** p ≤ 0.01). Statistical analyses at single-CpG levels were performed using one-way ANOVA followed by Tukey’s multiple comparison post-hoc test (* p ≤ 0.05; ** p ≤ 0.01; *** p ≤0.001). |