
FIGURE
Figure 5
- ID
- ZDB-FIG-210301-131
- Publication
- Cuomo et al., 2021 - DNA Methylation Profiles of Tph1A and BDNF in Gut and Brain of L. Rhamnosus-Treated Zebrafish
- Other Figures
- All Figure Page
- Back to All Figure Page
Figure 5
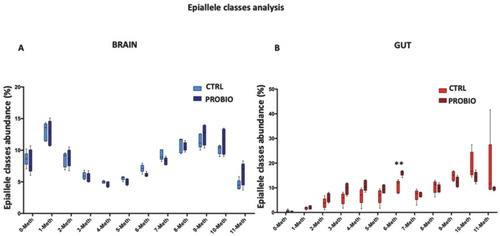
Epiallele classes distribution at the Tph1A promoter region in the gut and brain of CTRL and PROBIO groups. Boxplots show the relative abundance of different epiallelic classes (from 0 to 11 methyl-cytosine per molecule) in CTRL and PROBIO group and in (A) brain and (B) gut. Statistical analysis was performed using Multiple t-tests without correction. (** p ≤ 0.01). |
Expression Data
Expression Detail
Antibody Labeling
Phenotype Data
Phenotype Detail
Acknowledgments
This image is the copyrighted work of the attributed author or publisher, and
ZFIN has permission only to display this image to its users.
Additional permissions should be obtained from the applicable author or publisher of the image.
Full text @ Biomolecules