
- Title
-
DNA Methylation Profiles of Tph1A and BDNF in Gut and Brain of L. Rhamnosus-Treated Zebrafish
- Authors
- Cuomo, M., Borrelli, L., Della Monica, R., Coretti, L., De Riso, G., D'Angelo Lancellotti di Durazzo, L., Fioretti, A., Lembo, F., Dinan, T.G., Cryan, J.F., Cocozza, S., Chiariotti, L.
- Source
- Full text @ Biomolecules
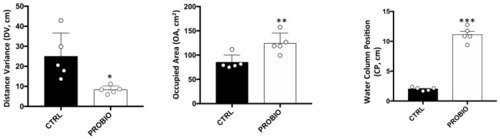
Behavioral parameters recorded in Zebrafish samples before and after probiotic treatment. Distance variance (DV), occupied area (OA) and water column position (CP) measurements in CTRL and RPOBIO groups. Statistical analysis has been performed using Student t-test (* p ? 0.05; ** p ? 0.01; *** p ? 0.001). |
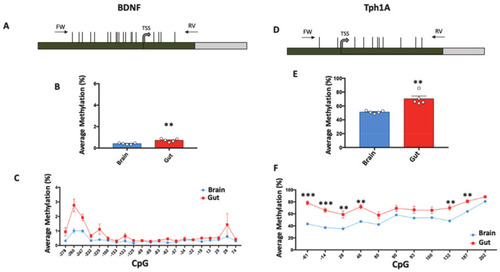
Tissue-specific DNA methylation of BDNF and Tph1A in gut and brain. (A) BDNF promoter region structure showing the position of analyzed CpGs (Horizontal black lines). The numbers of the CpG sites refer to the putative transcriptional start site (TSS), indicated with +1. Green box and gray box indicate promoter and the first intron, respectively. Positions of primers (FW: Forward; RV: Reverse) used for amplification procedure are reported. The BDNF sequence was retrieved by Ensembl with the following accession number: ENSDARG00000018817. (B) BDNF average methylation (%) in brain (Blue Box) and gut (Red Box) of untreated Zebrafishes is reported and indicated as the mean � standard error of five samples. (C) Average methylation at single CpG site (%) at the BDNF promoter region in brain and gut is reported with blue and red lines, respectively, and indicated as the mean � standard error of five samples. (D) Tph1A promoter region structure showing the position of the analyzed CpGs with numbers referring to the putative transcriptional start site (TSS). Green and gray boxes indicate promoter and the first intron, respectively. Black arrows at the top of the map specify the position of the primers used for bisulfite amplification. The Tph1A sequence was retrieved by Ensembl with the following accession number: ENSDARG00000029432. (E) Average methylation (%) at Tph1A in gut and brain of five control Zebrafishes. (F) Methylation level at single-CpG sites (%) in the Tph1A analyzed region. Comparison between brain and gut for both Tph1A and BDNF was performed using Student t-test (** p ? 0.01). Statistical analyses at single-CpG levels were performed using one-way ANOVA followed by Tukey?s multiple comparison post-hoc test (* p ? 0.05; ** p ? 0.01; *** p ?0.001). |
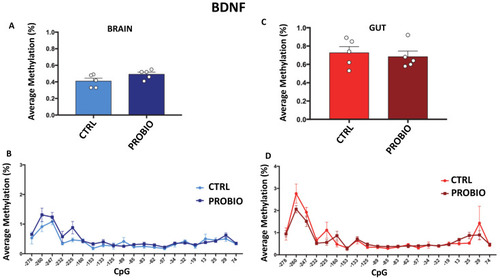
DNA methylation of BDNF in probiotic-treated and untreated Zebrafishes in the gut and brain. (A) Average methylation (%) of BDNF in the brain of untreated (CTRL) and probiotic-treated (PROBIO) Zebrafishes. Statistical analysis was performed using Student t-test. (B) Methylation level (%) at single-CpG sites was shown for the brain of CTRL and PROBIO groups. (C) BDNF average methylation (%) in the gut of untreated (CTRL) and probiotic-treated (PROBIO) Zebrafishes. Statistical analysis was performed using Student t-test. (D) Single-CpG methylation (%) at the BDNF promoter in the gut of CTRL and PROBIO groups. Statistical analyses were performed using one-way ANOVA followed by Tukey?s multiple comparison post-hoc test. |
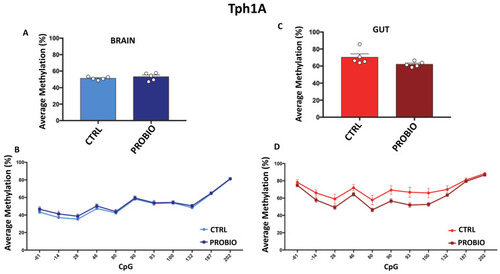
Comparison of Tph1A DNA methylation between CTRL and PROBIO groups in gut and brain. (A) Average methylation (%) of Tph1A in the brain of untreated (CTRL) and probiotic-treated (PROBIO) Zebrafishes. Statistical analysis was performed using Student t-test. (B) Methylation level (%) at Tph1A single-CpG sites was shown for the brain of CTRL and PROBIO groups. (C) Tph1A average methylation (%) in the gut of untreated (CTRL) and probiotic-treated (PROBIO) Zebrafishes. Statistical analysis was performed using Student t-test. (D) Single-CpG methylation (%) at the Tph1A promoter in the gut of the CTRL and PROBIO groups. Statistical analyses were performed using one-way ANOVA followed by Tukey?s multiple comparison post-hoc test. |
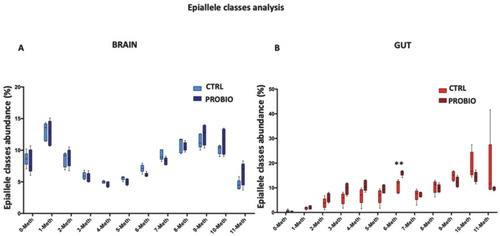
Epiallele classes distribution at the Tph1A promoter region in the gut and brain of CTRL and PROBIO groups. Boxplots show the relative abundance of different epiallelic classes (from 0 to 11 methyl-cytosine per molecule) in CTRL and PROBIO group and in (A) brain and (B) gut. Statistical analysis was performed using Multiple t-tests without correction. (** p ? 0.01). |
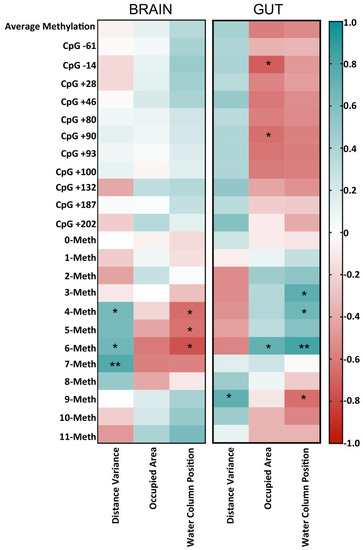
Correlogram showing Pearson correlation between DNA methylation data and behavioral parameters. The graph reports r values derived from Pearson correlation between average methylation, single-CpG methylation, epiallele classes and distance variance, occupied area and water column positions. The scale color from blue to red indicates a positive to negative correlation (?1 ? r ? 1). Statistical analyses were performed using a Pearson correlation test (* p ? 0.05; ** p ? 0.01). |