
Figure 3
- ID
- ZDB-FIG-210301-129
- Publication
- Cuomo et al., 2021 - DNA Methylation Profiles of Tph1A and BDNF in Gut and Brain of L. Rhamnosus-Treated Zebrafish
- Other Figures
- All Figure Page
- Back to All Figure Page
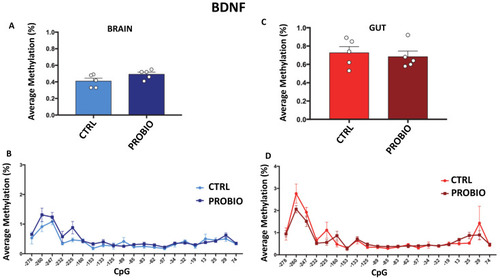
DNA methylation of BDNF in probiotic-treated and untreated Zebrafishes in the gut and brain. (A) Average methylation (%) of BDNF in the brain of untreated (CTRL) and probiotic-treated (PROBIO) Zebrafishes. Statistical analysis was performed using Student t-test. (B) Methylation level (%) at single-CpG sites was shown for the brain of CTRL and PROBIO groups. (C) BDNF average methylation (%) in the gut of untreated (CTRL) and probiotic-treated (PROBIO) Zebrafishes. Statistical analysis was performed using Student t-test. (D) Single-CpG methylation (%) at the BDNF promoter in the gut of CTRL and PROBIO groups. Statistical analyses were performed using one-way ANOVA followed by Tukey’s multiple comparison post-hoc test. |