
Figure 2—figure supplement 2.
- ID
- ZDB-FIG-210113-134
- Publication
- Wague et al., 2020 - Mechanistic insights into volatile anesthetic modulation of K2P channels
- Other Figures
- All Figure Page
- Back to All Figure Page
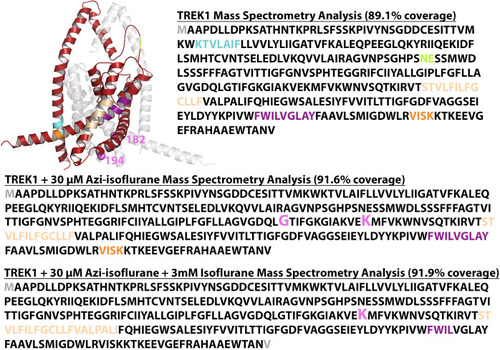
Results of MS analysis of TREK1 wildtype (WT) in the (top) absence of reaction with azi-isoflurane, (second) following reaction with 30 μM azi-isoflurane, (third) following reaction with 30 μM azi-isoflurane in the presence of 3 mM Isoflurane, or (bottom) TREK1 G182W following reaction with 30 μM azi-isoflurane. Regions positively identified by MS analysis are shown in red in the TREK1 structural model (PDB ID 6CQ6) and in black font in the sequence data. Regions absent from MS data occurred in five distinct regions, all of which are displayed in matching color in both the structural model and the sequence data. The G182 and K194 residues found to be modified by azi-isoflurane in TREK1 WT are shown as pink spheres in the structural model, and positive photolabeling is denoted in the sequence data by enlarged font and pink color. The A67 and T303 residues modified by azi-isoflurane in TREK1 G182W are similarly denoted in blue. The initial and final residues in the TREK1 protein were not identified in the majority of the MS results and are shown in gray to denote absence from positive MS identification. These residues are not present in the TREK1 structural model. |