
FIGURE
Figure 7—figure supplement 3
- ID
- ZDB-FIG-201216-41
- Publication
- Rogers et al., 2020 - Optogenetic investigation of BMP target gene expression diversity
- Other Figures
- All Figure Page
- Back to All Figure Page
Figure 7—figure supplement 3
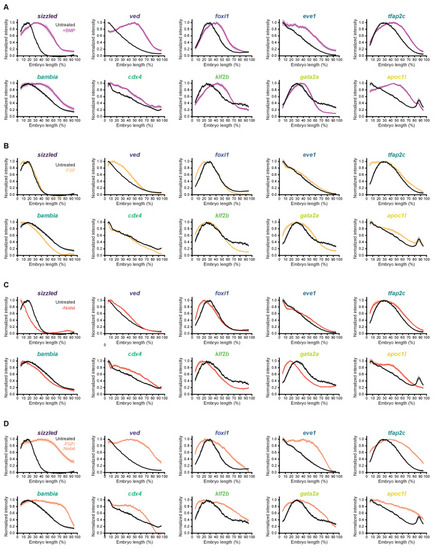
Spatial quantification of fluorescence in situ hybridization signal along the dorsal-ventral axis for BMP target genes at shield stage in embryos treated as indicated, compared to untreated spatial distributions (black). Normalized intensities are shown, error bars represent standard error. (A) Embryos were injected with 0.5 pg bmp2b mRNA at the one-cell stage. (B-D) Embryos were treated with 10 μM FGF inhibitor SU-5402 (B), 50 μM Nodal inhibitor SB-505124 (C), or both (D) starting at 2 hpf. See the Figure 7—figure supplement 3—source data 1 file for source data. |
Expression Data
Expression Detail
Antibody Labeling
Phenotype Data
Phenotype Detail
Acknowledgments
This image is the copyrighted work of the attributed author or publisher, and
ZFIN has permission only to display this image to its users.
Additional permissions should be obtained from the applicable author or publisher of the image.
Full text @ Elife