
Figure 3—figure supplement 1
- ID
- ZDB-FIG-201216-33
- Publication
- Rogers et al., 2020 - Optogenetic investigation of BMP target gene expression diversity
- Other Figures
- All Figure Page
- Back to All Figure Page
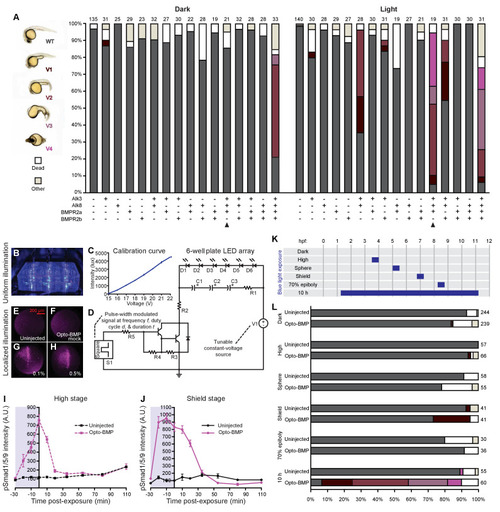
(A) Embryos injected with Opto-BMP-encoding mRNA at the one-cell stage were reared in the dark or exposed to white light, and phenotypes were scored at 1 day post-fertilization (dpf). Number of embryos analyzed is indicated on top of each bar. A combination of Opto-Alk3, Opto-Alk8, and Opto-BMPR2a (arrowheads) was used in subsequent experiments. Equimolar amounts of mRNA were injected: Opto-Alk3: 5.2 pg, Opto-Alk8: 5.2 pg, Opto-BMPR2a: 8.9 pg, Opto-BMPR2b: 5 pg. (B) Blue LEDs were embedded into the lid of a six-well dish. (C) LED intensity was measured three times with a luxmeter at different voltages. Averages are shown with piecewise linear interpolation; error bars represent standard error. (D) Circuit schematic for the LED array. A program-generated square wave on a single-board computer acts as a signal source (S1) controlling an amplifier to time the operation and intensity of an LED array (D1-6) run on a constant-voltage power supply (V1). S1: Square wave signal source. C1-3: 1000 μF, 10 V electrolytic capacitor, V1: Constant-voltage regulated power supply, D1-6: 470 nm blue light diode, R1: 200 Ω resistor, R2: 68 Ω, 2W choke resistor, R3: 70 Ω resistor, R4: 7 kΩ resistor, R5: 20 kΩ resistor. (E-H) Opto-BMP embryos were exposed to a 5–12 μm-thick sheet of 405 nm light at the indicated laser power for 3 min using SPIM. BMP signaling was assessed using pSmad1/5/9 immunofluorescence (animal views). Opto-BMP embryos exhibit localized BMP activation compared to uninjected (E) and mock-exposed Opto-BMP embryos (F). (I-J) Uninjected and Opto-BMP-injected embryos were exposed to blue light (2300 lux) for 30 min starting at high stage (3.5 hpf, I) or shield stage (6.75 hpf, J). pSmad1/5/9 immunofluorescence was quantified and plotted with piecewise linear interpolation between timepoints; error bars represent standard error (Materials and methods). Blue background represents light exposure. This data is shown in Figure 3C as Opto-BMP - uninjected intensity. (K) Uninjected and Opto-BMP embryos were reared in the dark or exposed transiently to blue light (2300 lux) for 30 min or 10 h at the indicated developmental stages. (L) Phenotypes were scored at 1 dpf; number of embryos analyzed is indicated to the right of each bar. See the Figure 3—figure supplement 1—source data 1 file for source data. |