
Figure 4
- ID
- ZDB-FIG-201216-34
- Publication
- Rogers et al., 2020 - Optogenetic investigation of BMP target gene expression diversity
- Other Figures
- All Figure Page
- Back to All Figure Page
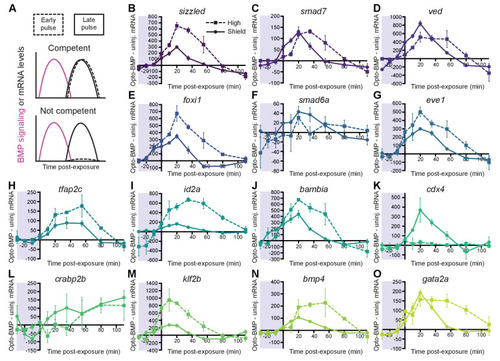
(A) Schematic of competence model: Late-activated genes should respond to a late (shield stage, solid line), but not early (high stage, dashed line) BMP signaling pulse. (B-O) High-confidence BMP target gene responses after an early (high stage,~3.5 hpf, dashed line) or late (shield stage,~6.75 hpf, solid line) BMP signaling pulse delivered by exposing uninjected and Opto-BMP-injected embryos to 30 min blue light (Figure 3C–E and Figure 3—figure supplement 1I,J). To assess induced transcription, NanoString transcript counts from uninjected embryos were subtracted from Opto-BMP transcript counts and are plotted here with piecewise linear interpolation between timepoints; error bars represent standard error (see Materials and methods for statistical analysis). See the Figure 4—source data 1 file for source data. |