
Figure 1
- ID
- ZDB-FIG-201216-29
- Publication
- Rogers et al., 2020 - Optogenetic investigation of BMP target gene expression diversity
- Other Figures
- All Figure Page
- Back to All Figure Page
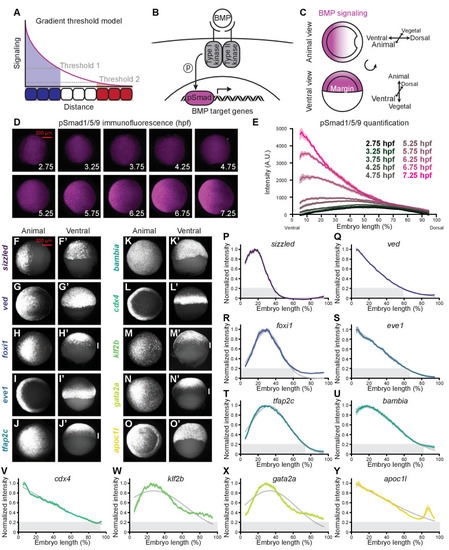
BMP target genes have diverse spatial expression patterns at shield stage. (A) The gradient threshold model states that a signaling gradient activates genes (blue, white, red) at different thresholds (dashed gray lines). (B) BMP binding induces receptor complex formation, phosphorylation of Smad1/5/9, and activation of target genes. (C) Schematic of shield-stage zebrafish embryos with BMP signaling gradients (magenta) along the dorsal-ventral axis. (D-E) Representative images (D) of pSmad1/5/9 immunofluorescence in embryos at the indicated time post-fertilization and quantification (E). (F-O’) Fluorescence in situ hybridization (FISH) showing spatial expression of the indicated high-confidence BMP target genes at shield stage (~6.75 h post-fertilization (hpf)). (F,G,H,I,J,K,L,M,N,O) are animal views, dorsal to the right. (F’,G’,H’,I’,J’,K’,L’,M’,N’,O’) are ventral views. Vertical white bars indicate regions where expression is excluded from the margin. (P-Y) Quantification of FISH signal along the dorsal-ventral axis for the indicated BMP target genes at shield stage (ventral on the left, dorsal on the right as in (E)). Normalized intensities are shown; error bars represent standard error. The Gaussian function Ae−(x−μ)2/ς was fitted to each profile (gray lines), and gene expression range was defined as r=μ+2√ς/2 (gray bars). Some BMP target genes could not be reliably quantified due to weak FISH signal (bmp4, id2a, smad6a, smad7, and znfl2b) or inability to reliably identify the ventral side in all assays (crabp2b). See the Figure 1—source data 1 file for source data. |