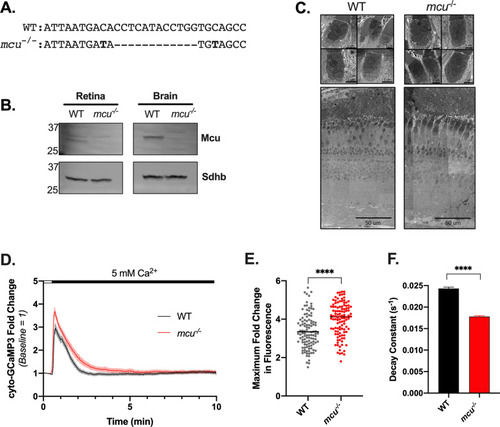
Mcu contributes to clearance of cytosolic Ca2+ in zebrafish cones. (A) Alignment of a portion of exon 5 of zebrafish mcu showing WT (top) and CRISPR-generated mcu-/- (mcuw249; bottom). (B) Western blot showing Mcu expression in retina and brain from global mcu-/- zebrafish. 20 µg of protein from mitochondrial lysate from 6 pooled retinas and 1 brain was analyzed. The custom Mcu antibody detects a faint non-specific band at a slightly higher molecular weight than Mcu. (C) Scanning electron microscopy (SEM) images of WT and mcu-/- zebrafish cone mitochondria (top panel) and retinas (bottom panel) from 11-month old sibling fish. Retinal and mitochondrial morphology appear unchanged by loss of Mcu (n = 8 retinas from WT and mcu/- zebrafish were examined, representative images from 1 WT and 1 mcu-/- retina are shown). (D) Traces of relative cyto-GCaMP3 fluorescence of cone cell bodies in adult retinal slices of WT or mcu-/- fish expressing gnat2:cyto-GCaMP3. Baseline mitochondrial fluorescence was determined in KRB buffer containing 0 mM CaCl2 and 0.4 mM EGTA, then a bolus of CaCl2 was delivered in order to bring the [Ca2+]free to 5 mM. The mean is reported and shaded region = 95% CI. (n = 110 cells (four fish) for WT and n = 112 cells (four fish) for mcu-/-). (E) Maximum fold change in cyto-GCaMP3 fluorescence for each cell body after exposure to 5 mM [Ca2+]free. WT: 3.345 ± 0.085, mcu-/-: 3.985 ± 0.082, mean ± SEM reported, p < 0.0001 using Welch’s t test. (n = 110 cells (from four fish) for WT and n = 112 cells (from four fish) for mcu-/-). (F) Decay constants calculated using a single exponential decay fit. WT: 0.02433 s−1 (0.02384 to 0.02483), mcu-/-: 0.01781 s−1 (0.01743 to 0.01821), decay constant with 95% CI reported, p < 0.0001 using Welch’s t test.
|
