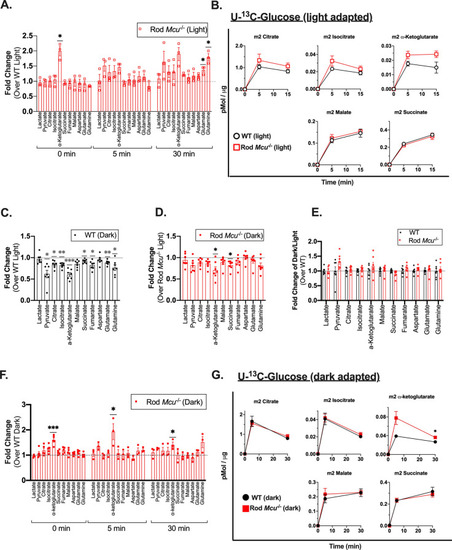
Loss of MCU leads to a buildup of α-ketoglutarate in Rod Mcu-/- retinas. (A) Total metabolite levels in light-adapted Rod Mcu-/- retinas relative to WT (n = 3 WT and 3 Rod Mcu-/- retinas per time point. Each time point used retinas from 3 different animals (*indicates p < 0.05 using Welch’s t test). (B) Time course of labeled metabolite accumulation in light-adapted WT and Rod Mcu-/- retinas incubated in U-13C-glucose for 0, 5, and 15 min (n = 3 WT and 3 Rod Mcu-/- retinas per time point. Each time point used retinas from 3 different mice. (C) Total metabolite levels in dark-adapted WT retinas relative to light-adapted WT retinas (n = 4 light adapted retinas and 7 dark adapted retinas, each from four different mice. *indicates p < 0.05, **indicates p < 0.01, ***indicates p < 0.001 using Welch’s t test). (D) Total metabolite levels in dark-adapted Rod Mcu-/- retinas relative to light-adapted Rod Mcu-/- retinas (n = 6 light adapted retinas and 7 dark adapted retinas, each from four different mice. * indicates p < 0.05 using Welch’s t test). (E) Change in metabolite abundance between darkness and light in Rod Mcu-/- retinas relative to WT retinas from Fig. 4C, D. (n = 4 light adapted WT retinas, 7 dark adapted WT retinas, 6 light-adapted Rod Mcu-/- retinas, and 7 light-adapted Rod Mcu-/- retinas, all ns using Welch’s t test). (F) Total metabolite levels in dark-adapted Rod Mcu-/- retinas relative to WT (n = 4 WT and 5 Rod Mcu-/-retinas for t = 0, n = 3 WT and 3 Rod Mcu-/- retinas for t = 5 and t = 30. Each time point used retinas from at least 3 different animals. *indicates p < 0.05, *** indicates p < 0.001 using Welch’s t test). (G) Time course of dark-adapted WT and Rod Mcu-/- retinas incubated in U-13C-glucose for 0, 5, and 30 min (n = 3 WT and 3 Rod Mcu-/- retinas per time point. Each time point used retinas from 3 different animals. *indicates p < 0.05 using Welch’s t test).
|
