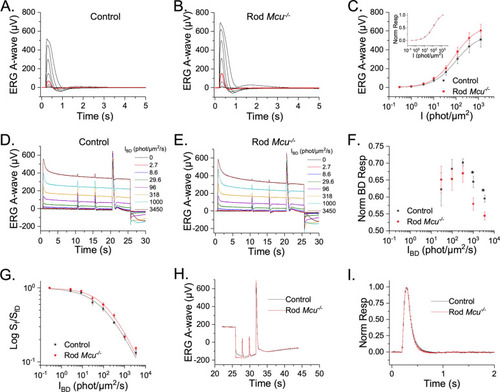
Mouse rods lacking Ca2+ uptake through MCU exhibit normal photoresponse. (A, B) Flash response families of dark adapted iCre+ (control; A) and Mcuf/f iCre+ (Rod Mcu-/-; B) mice from transretinal ERG recordings. Scotopic a-wave responses were recorded by a series of test flashes (1 ms in duration) with intensities (in photons/µm2) 0.3, 1, 3.5, 10.2 (red traces), 35.4, 117, 385, 1270. (C) Averaged rod responses (Mean ± SEM) from control (black) and Rod Mcu-/- mice (red) plotted as a function of flash intensity show only a marginal (p > 0.05) difference in the response amplitude between these groups (n = 10 for each). The solid lines represent curves fitted to the intensity response using the Naka–Rushton Function, R/Rmax = I/(I + I1/2). (Inset) Normalized intensity response curves showing no difference in sensitivity between control (black) and Rod Mcu-/- (red) mice. (D, E) ERG responses to steps of incremental background illumination of control (D) and Rod Mcu-/- mice (E) with subsequent responses to dim and saturating light flashes (n = 8 for each). (F) The background light response at plateau, normalized to the peak of the initial background response, as a function of background light intensity. The plateau response for the two brightest backgrounds was significantly lower for the Rod Mcu-/- responses compared to these from controls (n = 8 for each). (G) Light-adapted sensitivity, normalized to the corresponding dark-adapted value, plotted as a function of background light intensity. Solid lines represent curves fitted to the response plots using the Weber Fechner function. (n = 8 for each). (H) Rod sensitivity during subsequent dark adaptation was estimated from ERG responses to dim flashes recorded at 2 s and 4 s after turning off a step of background light; averaged traces for control (black; n = 8) and Rod Mcu-/- (red; n = 12) retinas are shown. No notable differences in the kinetics of the dim flash response between control and Mcu-/- rods at both 2 s and 4 s time points for the two brightest background steps (1000 and 3450 photons/μm2/s) were evident. (I) A representative plot for the flash responses recorded at 4 s after turning off the highest background (3450 photons/μm2/s) shows identical kinetics between control (n = 8) and Rod Mcu-/- (n = 12) responses.
|
