FIGURE

Figure 4

ID
ZDB-FIG-201003-214
Publication
Bisbach et al., 2020 - Mitochondrial Calcium Uniporter (MCU) deficiency reveals an alternate path for Ca2+ uptake in photoreceptor mitochondria
Other Figures
All Figure Page
Back to All Figure Page
Figure 4

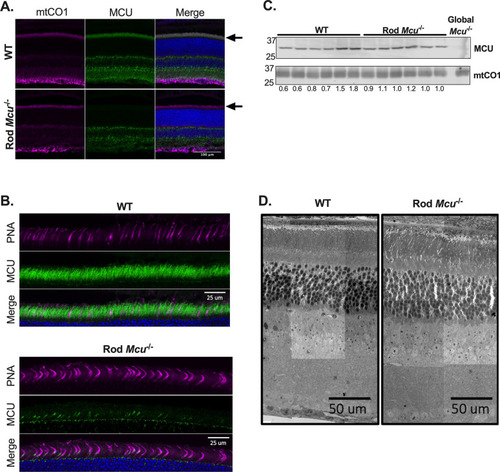
Rods express low levels of MCU. (A) Immunohistochemistry showing MCU expression in WT and Rod Mcu-/- retinas. mtCO1 (Mitochondrial Cytochrome Oxidase subunit 1) is used to label mitochondria. An arrow indicates the photoreceptor mitochondria layer. (B) Immunohistochemistry showing MCU expression and PNA-647 (staining cone outer segments). MCU is still expressed in cones from Rod Mcu-/- retinas. (C) Western blot showing MCU expression in whole retinas from Rod Mcu-/- mouse. 15 µg of retinal protein lysate was loaded in each lane. MCU expression is not significantly altered in Rod Mcu-/- retinas (1.02 ± 0.03 fold higher in Rod Mcu-/- retinas, mean ± standard deviation is reported, ns using Welch’s t test). Retinal lysate from a global Mcu-/- mouse is used as a control to show specificity of MCU antibody (far right lane). The MCU/mtCO1 ratio for each sample relative to WT average is shown under each lane (n = 6 WT and 6 Rod Mcu-/- retinas from 3 animals each). (D) SEM images from 6-month old WT and Rod Mcu-/- retinas (retinas from n = 3 mice were imaged, representative images from 1 WT and 1 Rod Mcu-/- retina shown).

Expression Data

Expression Detail
Antibody Labeling
Phenotype Data

Phenotype Detail
Acknowledgments
This image is the copyrighted work of the attributed author or publisher, and ZFIN has permission only to display this image to its users. Additional permissions should be obtained from the applicable author or publisher of the image. Full text @ Sci. Rep.