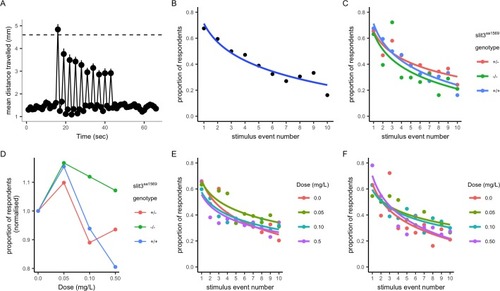
(A–B) Response and habituation to 10 stimuli with two seconds interval between stimuli in wild type, drug free zebrafish. Mean distances travelled were measured in one second time bins. Line indicates 4.6 mm, which corresponds to mean basal distance moved per second plus 2 standard deviations of the mean and was used to define respondents. The percentage of fish responding to the stimuli decreases with stimulus/tap number (Main effects of tap number p<0.05) 68% respond to the first tap; 16% respond to the last tap. Respondents are defined as fish moving more than 4.6 mm. (C) Proportion of responders across the ten stimuli in drug free individuals from each genotype: there was no significant effect of genotype on response across taps (p=0.34) or responsiveness (p=0.35) in drug free fish. (D) Mean percentage of responders across the ten stimuli (± SEM). Data are stratified by slit3sa1569 genotype and amisulpride dose normalised to response in absence of drug. The effect of amisulpride on habituation varies by genotype. (E, F) Proportion of individuals responding in each amisulpride dose condition in wild type and homozygous mutant fish, respectively. The interaction between amisulpride dose and stimulus event number had a significant effect on the proportion of responsive individuals in wild type individuals (p<0.05) but not homozygous mutants (p=0.16).
|
