
Fig. 3
- ID
- ZDB-FIG-200327-18
- Publication
- Li et al., 2019 - Development and organization of the zebrafish intestinal epithelial stem cell niche
- Other Figures
- All Figure Page
- Back to All Figure Page
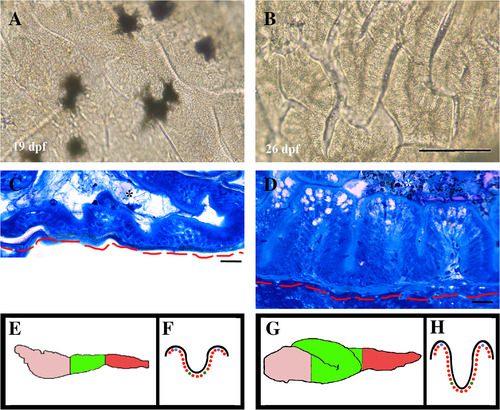
Intestinal fold appearance. Intestinal folds viewed from the lumen side are defined at 19 dpf but appear shallow (A). Folds appear deeper by 26 dpf (B). Histological sections of 19 dpf folds (C) appear less developed than folds of 26 dpf intestines (D). Images from the lumen side and the histological images are from the anterior most portion of the mid region of the intestine as diagramed in the green lateral view of 19 dpf (E) and ventral view of 26 dpf (G); anterior is to the left). Cartoons in E to H also diagram regions recorded in Table 1. Anterior, pink; green, mid; red, posterior (E,G). The 19 dpf (F) and 26 dpf (H) diagram regions of folds recorded: black line represents the fold and dots represent nuclei. Green to green nuclei is width of base; green to blue (at tip of fold‐ top of diagram) is height of fold. Scale bar = 200 μm in A,B; 20 μm in C,D. Red line base of mesenchyme/limit of intestine; asterisk, lumen in C and D. |