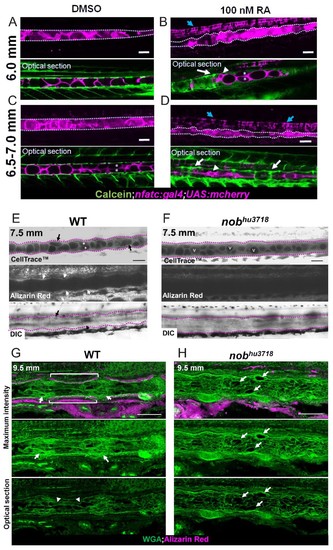
( A, C) Live confocal images of fish treated with 0.0002% DMSO for 1 week at 6.0 mm and 6.5–7 mm respectively. ( B, D) Live confocal images of fish treated with 100 nM RA for 1 week at 6.0 mm and 6.5–7 mm respectively. Fish expressed nfatc:gal4;UAS:mcherry in the notochord and were stained with calcein to label centra. Scale bar = 100 µm. n = 3 for DMSO control and RA treatment. Notochord is outlined with a dotted white line. White arrows point to areas of increased mineralization, blue arrows point to the floor plate. Arrowheads indicate areas of increased vacuole fragmentation. Asterisks mark vacuolated cell stacking. ( E) Live confocal image of a 7.5 mm WT zebrafish stained with Cell Trace to visualize internal membranes and live alizarin to label mineralized bone, n = 3. ( F) Live confocal image of a 7.5 mm nobhu3718 stained with Cell Trace and alizarin red to label bone. n = 3. Black arrows point to vacuolated cells undergoing shape change. Asterisks mark stacked vacuolated cells. White arrows point to centra stained with alizarin red. v indicates rounded vacuoles that have not undergone shape change, fragmentation, or stacking. The notochord is outlined with a dotted fuchsia line. Scale bar = 100 µm. ( G–H) Cryosections of a 9.5 mm WT ( G) and nobhu3718 ( H) larvae stained with WGA (green) and alizarin red (magenta). Brackets indicate IVD domains. Arrows point to mineralized centra. The notochord is outlined with a dotted white line. Arrowheads point to mesenchymal condensations. Scale bar = 100 µm.