
Fig. 9
- ID
- ZDB-FIG-200325-203
- Publication
- Bagwell et al., 2020 - Notochord vacuoles absorb compressive bone growth during zebrafish spine formation
- Other Figures
- All Figure Page
- Back to All Figure Page
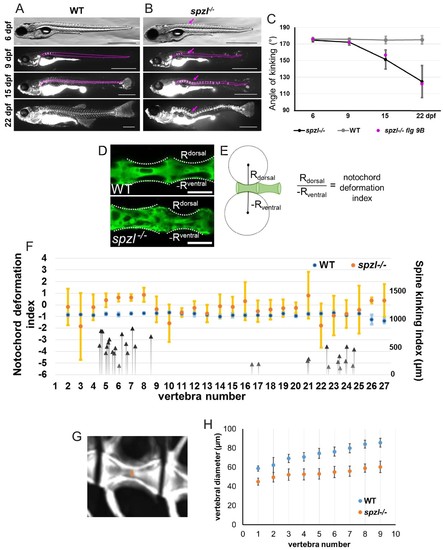
Loss of notochord vacuole integrity leads to spine kinking in spzl mutants during vertebral bone growth.( A–B) Individual ( A) WT and ( B) spzl-/- fish were incubated with calcein and imaged under a fluorescence compound microscope throughout the time course of spine development. The dotted lines mark the notochord and spine and the magenta arrows mark developing kinks in the spine over time. The solid magenta lines mark that area where we measured the angle of kinking. Scale bars are 1 mm. ( C) Quantification of the angle of spine kinking over time. Magenta dots refer to the representative fish in panel ( B). n = 3 for WT, n = 18 for spzl-/-. Note that axis kinking starts after the onset of mineralization and gets progressively sharper as vertebral bone grows. ( D) Optical confocal section of WT (top) and spzl-/- (bottom) expressing GFP in the cytoplasm of notochord vacuolated cells. Dotted line label the deformation angle caused by the growing vertebrae. The radius of this angle was then used to determine the notochord deformation index. Scale bar = 100 µm. ( E) Cartoon depicting how the notochord deformation index was calculated. Normal vertebral growth should have a notochord deformation index of ~−1. ( F) Notochord deformation index in 6.5–7.55 mm WT (blue) and 28 dpf spzl-/- larvae (orange). Fish were matched by bone development. n = 3 for WT, n = 5 for spzl-/-. Error bars are SD. The larger deviation illustrates that lack of symmetry in the notochord deformation in the spzl-/-mutants. Black arrows point to the vertebral location of spine kinks and the magnitude (in μm) they deviate from the center line in spzl-/- mutants (n = 18). Note that most kinks occur adjacent to areas where the asymmetric notochord deformation changes in orientation. ( G) μCT image of a 2 mpf WT vertebra. Orange arrow indicates location of canal diameter measurements. ( H) Canal diameter measurements from vertebrae 2–10 for WT (blue) and spzl-/-(orange). The decreased size of the vertebral canal suggests the notochord is more deformable in spzl-/- respect to WT. For WT n = 5. For spzl mutants n = 5. |
| Fish: | |
|---|---|
| Observed In: | |
| Stage Range: | Day 6 to Days 45-89 |