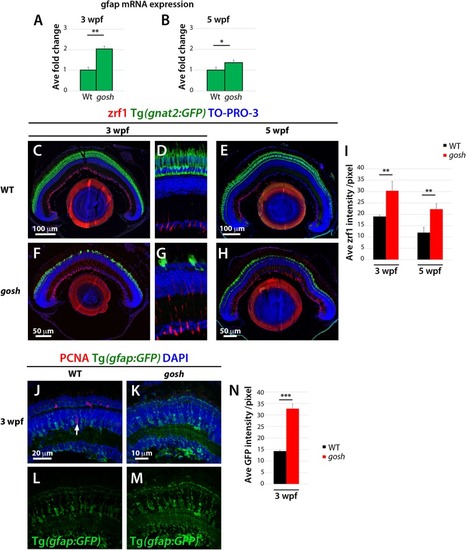
Non-proliferative gliotic response in gosh mutants at 3 wpf. (A,B) Upregulation of GFAP mRNA expression in gosh samples at 3 and 5 wpf compared with control samples. (C–H) Paraffin sections labeled with zrf1 antibody, which recognizes GFAP. Cones are visualized with GFP expression of T(gnat2:GFP). Nuclei are stained with TO-PRO-3. In wild type, inner radial processes of Müller glia are faintly stained with zrf1 antibody at 3 and 5 wpf (C–E). However, in gosh mutants, radial processes of Müller glia are more intensely labeled at 3 and 5 wpf, indicating cell hypertrophy with upregulation of GFAP (F–H). (I) Histogram of GFAP-positive area in wild-type and gosh mutant retinas at 3 and 5 wpf. GFAP signals are higher in gosh mutants than in wild type at both 3 and 5 wpf. (J–M) Tg(gfap:GFP)nt11 visualizes Müller glia at 3 wpf. Proliferative Müller glia, NPCs, and rod precursor cells are labeled with PCNA antibody, and nuclei are counterstained with DAPI. In wild-type retinas, GFAP is observed in cell bodies and apico-basal extended processes of Müller glia (J,L). Some Müller glia express PCNA (J, arrow). PCNA-positive cells are also observed in the ONL, indicating persistent neurogenesis to produce rod photoreceptors. In contrast, PCNA expression is absent or very low in gosh mutants at 3 wpf (K). GFAP is upregulated in Müller cells, which show a greater number of cell processes (K,M). Notice the strong GFP fluorescence in the ONL, where photoreceptors are degenerating. (N) Histogram of gfap-positive area in control and gosh retinas depicts the increase of fluorescence in the mutant retina.
|
