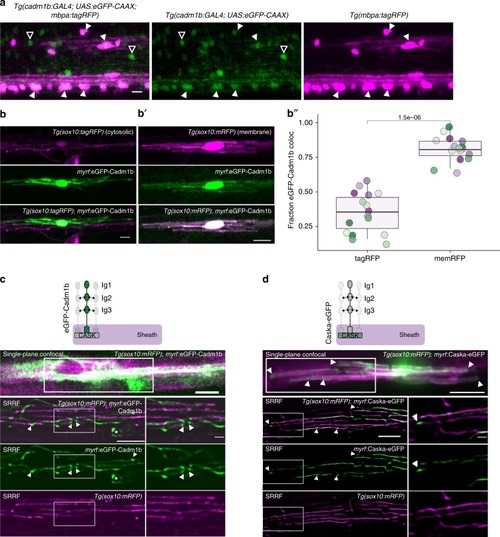
Cadm1b localizes to myelin sheath membrane. a CRISPR/Cas9-mediated GAL4 enhancer trap of cadm1b reports cells expressing cadm1b via UAS:eGFP-CAAX expression. Larvae additionally carrying Tg(mbpa:tagRFP) reveal mbp + myelinating oligodendrocytes. Closed arrowheads indicate mbp + , cadm1b + oligodendrocytes, whereas open arrowheads indicate mbp-, cadm1b + cells (likely neurons). Scale bar, 10 µm. b, b′) Expression of myrf:eGFP-Cadm1b in Tg(sox10:tagRFP) (b) or Tg(sox10:mRFP) (c) co-labeled oligodendrocytes. b′′ Fraction of eGFP-Cadm1b colocalized with RFP (Mander’s colocalization coefficient) for Tg(sox10:tagRFP) (tagRFP) and Tg(sox10:mRFP) (memRFP). n = 16 cells (tagRFP), 16 cells (memRFP), Wilcox rank-sum test. Colored dots represent individual cells. c Confocal single-plane (top) and super resolution radial fluctuations (SRRF) (bottom 3 panels) imaging of a eGFP-Cadm1b expressing oligodendrocyte in a Tg(sox10:mRFP) larva. Arrowheads indicate eGFP-Cadm1b puncta that are not present in mRFP SRRF. Asterisk marks a sheath going in to the plane of view with circular edges surrounded by eGFP-Cadm1b puncta. Scale bars 5 µm except for innermost inset, 1 µm. d Similar to c for an oligodendrocyte expressing Caska-eGFP. Scale bars 10 µm (top), 5 µm (left SRRF), 1 µm (SRRF insets)
|
