IMAGE

Fig. 5

ID
ZDB-IMAGE-191230-950
Genes
Source
Figures for Hughes et al., 2019
Image
Figure Caption

Fig. 5

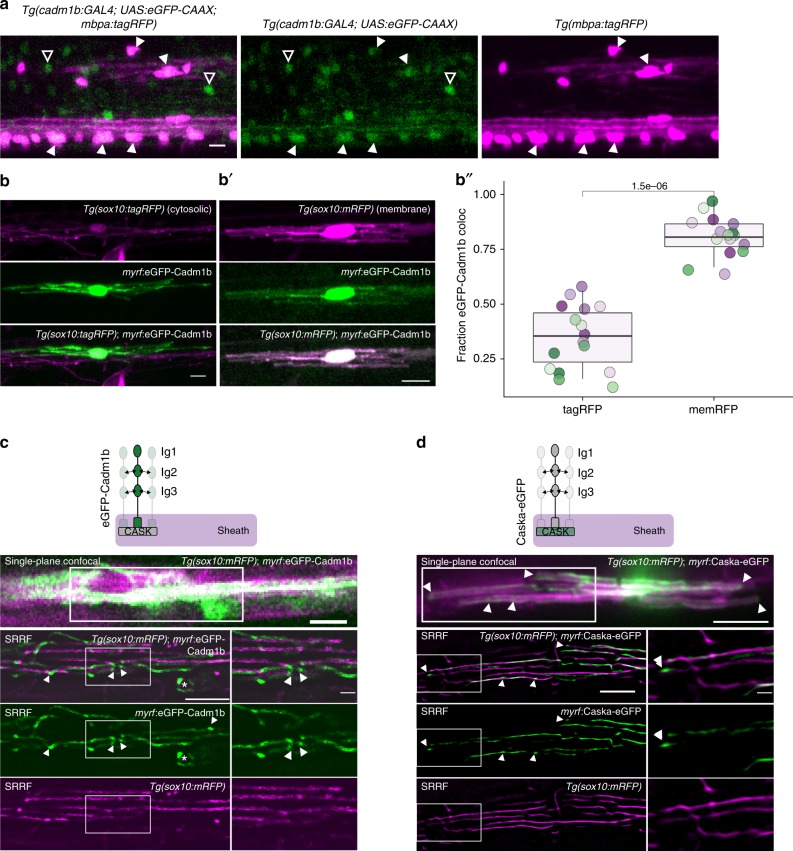
Cadm1b localizes to myelin sheath membrane. a CRISPR/Cas9-mediated GAL4 enhancer trap of cadm1b reports cells expressing cadm1b via UAS:eGFP-CAAX expression. Larvae additionally carrying Tg(mbpa:tagRFP) reveal mbp + myelinating oligodendrocytes. Closed arrowheads indicate mbp + , cadm1b + oligodendrocytes, whereas open arrowheads indicate mbp-, cadm1b + cells (likely neurons). Scale bar, 10 µm. b, b′) Expression of myrf:eGFP-Cadm1b in Tg(sox10:tagRFP) (b) or Tg(sox10:mRFP) (c) co-labeled oligodendrocytes. b′′ Fraction of eGFP-Cadm1b colocalized with RFP (Mander’s colocalization coefficient) for Tg(sox10:tagRFP) (tagRFP) and Tg(sox10:mRFP) (memRFP). n = 16 cells (tagRFP), 16 cells (memRFP), Wilcox rank-sum test. Colored dots represent individual cells. c Confocal single-plane (top) and super resolution radial fluctuations (SRRF) (bottom 3 panels) imaging of a eGFP-Cadm1b expressing oligodendrocyte in a Tg(sox10:mRFP) larva. Arrowheads indicate eGFP-Cadm1b puncta that are not present in mRFP SRRF. Asterisk marks a sheath going in to the plane of view with circular edges surrounded by eGFP-Cadm1b puncta. Scale bars 5 µm except for innermost inset, 1 µm. d Similar to c for an oligodendrocyte expressing Caska-eGFP. Scale bars 10 µm (top), 5 µm (left SRRF), 1 µm (SRRF insets)

Figure Data
Acknowledgments
This image is the copyrighted work of the attributed author or publisher, and ZFIN has permission only to display this image to its users. Additional permissions should be obtained from the applicable author or publisher of the image. Full text @ Nat. Commun.