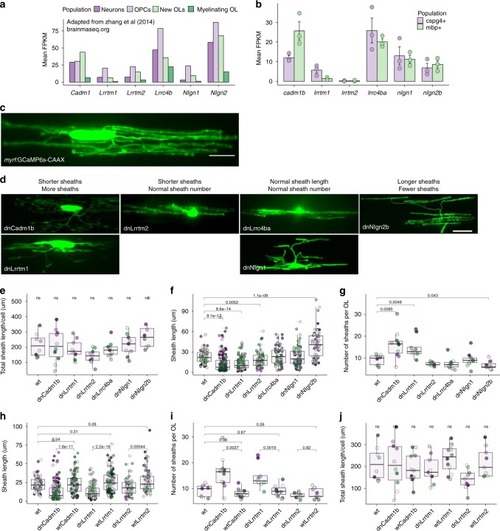
Candidate synaptogenic adhesion molecules have variable effects on myelin sheath length and number. a RNA-seq FPKM values for mouse cortical neurons, OPCs, new oligodendrocytes, and myelinating oligodendrocytes for candidates Cadm1, Lrrtm1, Lrrtm2, Lrrc4b, Nlgn1, and Nlgn2. Plot generated using publicly available values from brainrnaseq.org14. b RNA-seq FPKM values for FAC-sorted zebrafish olig2 + /cspg4 + (cspg4 + ) and mbpa + /olig2 + (mbp + ) cells for zebrafish homologs of the same candidates36. c Oligodendrocyte transiently expressing myrf:GCaMP6s-CAAX. Scale bar 10 µm. d Candidate dominant-negative (dn) alleles expressed transiently as myrf:dnX-2A-GCaMP6s-CAAX and grouped by effect on sheath length and number. Scale bar 10 µm. e Total sheath length per cell expressing each dominant-negative candidate was unchanged by all candidates, Kruskal–Wallis test. Dot color marks individual cells and matches colored dots in corresponding sheath length and number plots. f Sheath length values for each dominant-negative candidate. n (cells/sheaths) = 8/74 wt, 10/159 dnCadm1b, 9/132 dnLrrtm1, 9/67 dnLrrtm2, 9/68 dnLrrc4ba, 9/83 dnNlgn1, 8/55 dnNlgn2b. Data in plots f–i were tested by Wilcox rank-sum with Bonferroni-Holm correction for multiple comparisons. dnLrrc4ba/wt and dnNlgn1/wt comparisons were ns. g Sheath number values for each dominant-negative candidate (n listed in f). h Decreased sheath length in dnCadm1b, dnLrrtm1, and dnLrrtm2 cells is specific to the DN disruption, because expression of the full-length (wt) protein does not reduce sheath length. n(cells/sheaths) = 11/91 wtCadm1b, 12/108 wtLrrtm1, 9/72 wtLrrtm2. i Expression of WT forms of the three candidates that reduced sheath length resulted in normal sheath number. j Total sheath length per cell expressing each WT candidate was not significantly different for any group, Kruskal–Wallis test
|
