
Figure 6
- ID
- ZDB-FIG-191230-134
- Publication
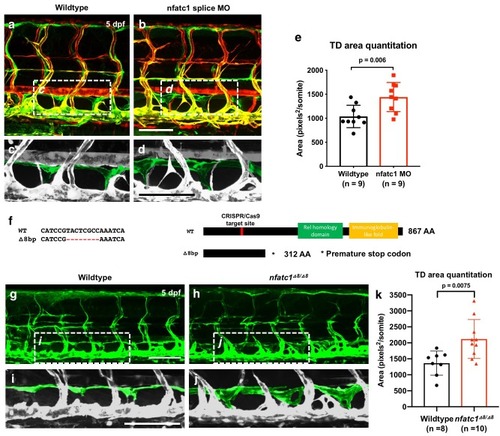
- Jung et al., 2019 - MicroRNA-mediated control of developmental lymphangiogenesis
- Other Figures
-
- Figure 1
- Figure 1—figure supplement 1.
- Figure 1—figure supplement 2.
- Figure 2
- Figure 2—figure supplement 1.
- Figure 2—figure supplement 2.
- Figure 3
- Figure 3—figure supplement 1.
- Figure 3—figure supplement 2.
- Figure 4
- Figure 4—figure supplement 1.
- Figure 5
- Figure 6
- Figure 6—figure supplement 1.
- Figure 7
- All Figure Page
- Back to All Figure Page
( |
| Fish: | |
|---|---|
| Knockdown Reagent: | |
| Observed In: | |
| Stage: | Day 5 |