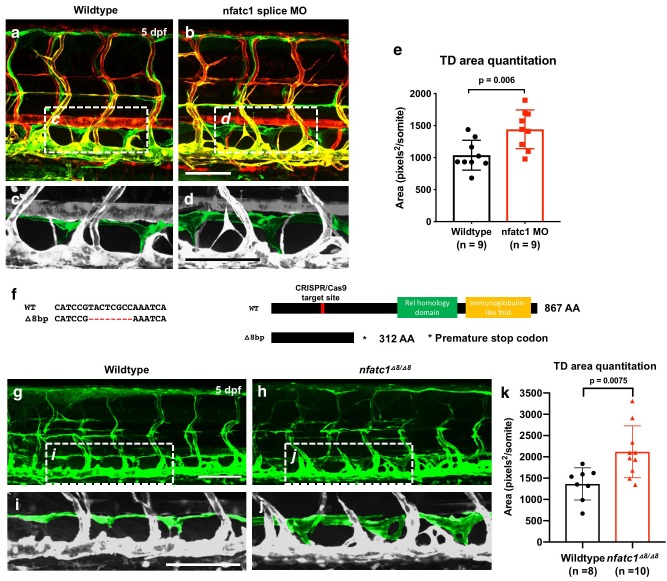
(a,b) Confocal images of the mid-trunk of 5 dpf Tg(mrc1a:eGFP)y251, Tg(kdrl:mCherry)y171 control (a) and nfatc1 ATG MO-injected (b) animals. The dashed boxes in panels a and b show the areas magnified in panels c and d, respectively. (c,d) Magnified images from panels a and b, with the thoracic duct pseudocolored in green and other vessels in gray. (e) Quantitation of thoracic duct size measured as the area encompassed by the thoracic duct in confocal images of the same seven mid-trunk somitic segments in five dpf wildtype (n = 11) and nfatc1 MO-injected (n = 9) animals. (f,g) Confocal images of the mid-trunk of 5 dpf DMSO (f) and cyclosporine A (g) treated animals. The dashed boxes in panels f and g show the areas magnified in panels h and i, respectively. (h,i) Magnified images from panels f and g, with the thoracic duct pseudocolored in green and other vessels in gray. (j) Quantitation of thoracic duct size measured as the area encompassed by the thoracic duct in confocal images of 7 somitic segments from five dpf DMSO (n = 16) and cyclosporine A (n = 17) treated animals. All images are lateral views, rostral to the left. Scale bar: 100 μm (a,c). All graphs are analyzed by t-test and the mean ± SD is shown.
This image is the copyrighted work of the attributed author or publisher, and
ZFIN has permission only to display this image to its users.
Additional permissions should be obtained from the applicable author or publisher of the image.
Full text @ Elife
Your Input Welcome
Thank you for submitting comments. Your input has been emailed to ZFIN curators who may contact you if
additional information is required.
Oops. Something went wrong. Please try again later.