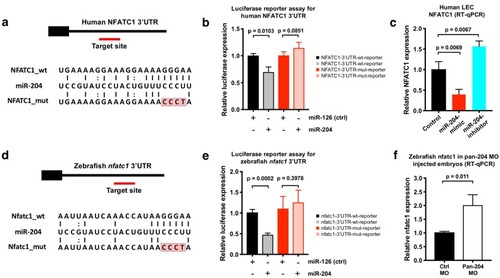
(a) Sequence alignment of mature miR-204 (middle line) and its target region in the human NFATC1 3’UTR (top line). A mutant form of the human NFATC1 3’UTR used for the luciferase assay in panel b is also shown (bottom line; four mismatches in the seed binding region are highlighted in red). (b) Quantitative luciferase reporter assay using wild type or mutant forms of the human NFATC1 3’UTR transfected into HEK293 cells together with either miR-204 or miR-126 (control). Four biological replicates were analyzed. (c) Quantitative TaqMan RT-PCR measurement of relative endogenous NFATC1 transcript levels in human LEC (HMVEC-dLy) transfected with miR-204-mimic or miR-204-antagomir, normalized to control mock transfected levels. (d) Sequence alignment of mature miR-204 (middle line) and its target region in the zebrafish nfatc1 3’UTR (top line). A mutant form of the zebrafish nfatc1 3’UTR used for the luciferase assay in panel e is also shown (bottom line; four mismatches in the seed binding region are highlighted in red). (e) Quantitative luciferase reporter assay using wildtype or mutant forms of the zebrafish nfatc1 3’UTR co-transfected into HEK293 cells together with either miR-204 or miR-126 (control). Four biological replicates were analyzed. (f) Quantitative TaqMan RT-PCR measurement of relative endogenous zebrafish nfatc1 transcript levels in five dpf animals that were injected with either control MO or pan-204 MO. Three biological replicates were analyzed. All graphs are analyzed by t-test and the mean ± SD is shown.
10.7554/eLife.46007.020
Numerical data for <xref rid='fig5' ref-type='fig'>Figure 5</xref>.
Expression Data
Expression Detail
Antibody Labeling
Phenotype Data
Phenotype Detail
Acknowledgments
This image is the copyrighted work of the attributed author or publisher, and
ZFIN has permission only to display this image to its users.
Additional permissions should be obtained from the applicable author or publisher of the image.
Full text @ Elife
Your Input Welcome
Thank you for submitting comments. Your input has been emailed to ZFIN curators who may contact you if
additional information is required.
Oops. Something went wrong. Please try again later.