
Fig. 2
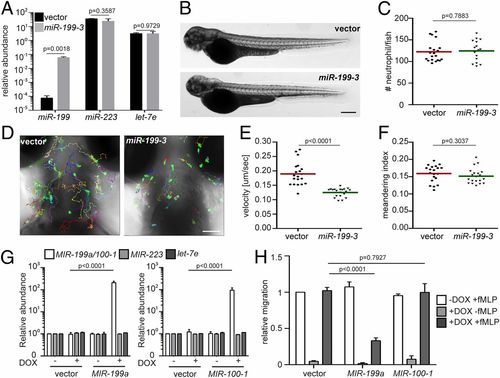
miR-199-3–overexpression reduces neutrophil migration in zebrafish and humans. (A) Quantification of miR-199, miR-223, and let-7e levels in neutrophils sorted from the vector or miR-199-3 zebrafish lines. Neutrophils were isolated from 2 adult kidney marrows from 2 different founders. Results are normalized to u6 expression levels and presented as mean ± SD, using the Holm–Sidak test. Representative images (B) and quantification (C) of total neutrophils in the vector or miR-199-3 zebrafish lines are shown. (Scale bar, 500 μm.) The assays were done with 3 individual founders with 3 biological repeats, each containing 20 fish per group. The result from one representative experiment is shown as mean ± SD, using the Mann–Whitney test. Representative images (D), velocity (E), and meandering index (F) of neutrophil motility in vector or miR-199-3 zebrafish lines are shown. (Scale bar, 100 μm.) Three embryos each from 3 different founders were imaged, and quantification of neutrophils in one representative video is shown. The Kruskal–Wallis test was used. (G) Quantification of MIR-100/199, MIR-233, and LET-7E in dHL-60 cell lines with/without induced expression of the vector control or MIR-100/199. The results from 3 independent experiments are normalized to U6 expression levels and presented as mean ± SD, using the Holm–Sidak test. DOX, doxycycline. (H) Transwell migration of dHL-60 cells with/without induced expression of the vector control, MIR-199, or MIR-100 toward fMLP. Results are presented as mean ± SD from 3 independent experiments and normalized to the vector −DOX + fMLP, using the Kruskal–Wallis test. |