|
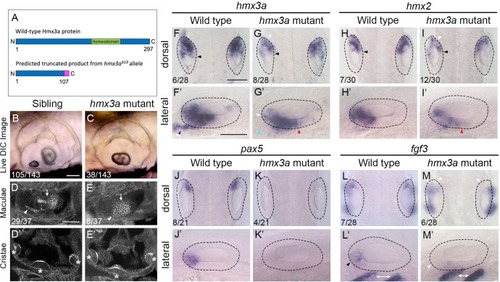
Fused otoliths and sensory maculae, and reduction of anterior otic character, in <italic>hmx3a</italic><sup><italic>SU3/SU3</italic></sup> mutants.(A) Schematic diagram showing the predicted truncated product for the hmx3aSU3 allele. The mutation was generated using a CRISPR sgRNA targeting sequence in exon 2 upstream of the DNA-binding homeodomain (green). The predicted truncated protein produced by the hmx3aSU3/SU3 allele contains a Thr to Gly substitution at amino acid 107, followed by a stretch of 10 further incorrect amino acids (magenta). The truncated protein lacks the homeodomain. (B,C) Differential interference contrast (DIC) images of ears in live embryos at 3 dpf (72 hpf). Numbers of embryos in a batch from a mating between heterozygous parents are given. Note the fused otolith in the hmx3aSU3/SU3 mutant ear (C). (D–E’) FITC-phalloidin stains of the sensory maculae (D,E) and cristae (D’,E’) in the ear at 3 dpf (72 hpf). Numbers of embryos showing the phenotype from a cross between heterozygous parents are shown. White arrowhead: anterior macula; white arrow: posterior macula; asterisks indicate cristae. Additional examples are shown in S9 Fig. (F–M’) In situ hybridisation for otic anterior markers at 24 hpf in genotyped wild-type and hmx3aSU3/SU3 mutant embryos. The dotted outline marks the outer edge of the otic epithelium. Black arrowheads in F–I indicate the extent of hmx expression in medial epithelium; white arrowheads indicate areas of reduced expression levels; blue arrowhead in F’ marks presumed otic or anterior lateral line neuroblasts; light blue arrowhead in G’ indicates loss of expression in this area; red arrowheads in G’,I’ mark expansion of expression in ventral otic epithelium. Black arrowhead in L’ indicates anterior otic expression domain of fgf3, lost in M,M’ (white arrowheads); white double-headed arrows mark expression of fgf3 in pharyngeal pouch endoderm. Numbers in panels F–M indicate numbers of embryos genotyped as either wild type or homozygous mutant that showed the representative expression patterns illustrated. Scale bars, 50 μm (scale bar in B applies to B,C; scale bar in D applies to D–E’; scale bar in F applies to F–I, J–M; scale bar in F’ applies to F’–I’, J’–M’).
|