
Fig. S1
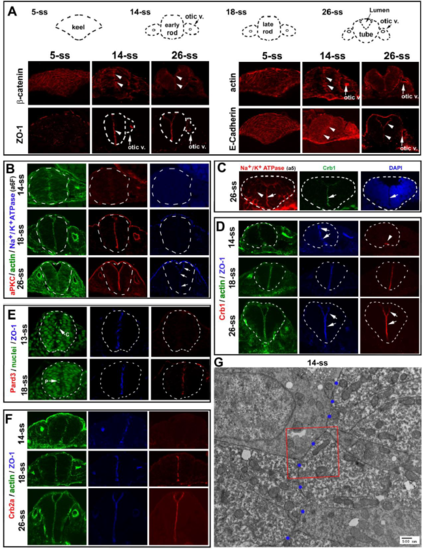
Apical polarity proteins localize or enrich in a stepwise fashion at the apical surfaces in rhombomeres 5 and 6 during neurulation A. As revealed by immunohistochemistry, E-Cadherin, -catenin, and F-actin localized broadly to the entire cell membranes at 5-ss, and then enriched apically at 14-ss and 26-ss. At 26-ss, E Cadherin signals in the dorsal region of the neural tube and the otic vesicle were stronger than those in the mid-ventral regions. ZO-1 initially scattered as small punctate sites at 5-ss and later enriched apically (14-ss, 26-ss). Arrowheads point at the apical surfaces; arrows otic v. point at the otic vesicles. Note that it is unknown to what extent the E-Cadherin immunostaining signals represented P-Cadherin because the E-Cadherin antibody cross-reacts with P-cadherin (http://www.bdbiosciences.com/ds/pm/tds/610182.pdf). B. Simultaneous immunostaining of Factin bundles, aPKC, and Na+/K+ ATPase (with the a6F antibody) at 14-ss, 18-ss, and 26-ss. Note the lack of aPKC staining at 14-ss as well as Na+/K+ ATPase staining at 14-ss and at 18-ss. C. Apical enrichment of Na+/K+ ATPase α (with weak lateral membrane staining) at 26-ss was also confirmed with the a5 antibody. Note that all other Na+/K+ ATPase α images in this study were visualized with the a6F antibody. D. Simultaneous immunostaining of ZO-1, F-actin, and Crb1 at 14-ss, 18-ss, and 26-ss. Note the lack of Crb1 staining at 14-ss, except at the very ventral end (arrowhead). E. Simultaneous immunostaining of ZO-1 and Pard3, counterstained with nuclear dye DAPI (blue). Note the lack of Pard3 signals at 13-ss. Arrow C indicates a cell going through a C-division at 13-ss when Pard3 was not detectable; arrow P indicates a cell going through a P-division at 18-ss when Pard3 became detectable at the apical surfaces. F. Simultaneous immunostaining of F-actin bundles, ZO-1, and Crb2a. Note the lack of Crb2a at 14-ss. G. A TEM image at a lower magnification illustrates the apical surfaces (marked by blue dots) juxtaposed at the midline. The boxed area was magnified in Figure 1E. |