
Fig. S6
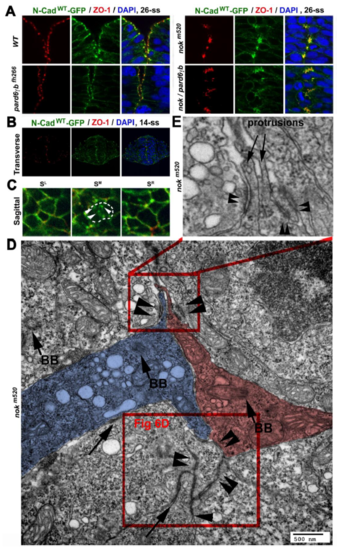
Intermediate proteins maintain PAA integrity and specificity A. Single channel images of Figure 6A illustrate the distribution of ZO-1 and N-Cadwt-GFP in wildtype, nokm520, pard6γbfh266, and nokm520/pard6γbfh266 mutant embryos at 26-ss. B. Transverse confocal imaging of 21 siblings of nokm520 heterozygous parents revealed no difference in the apical distributions of ZO-1 and N-Cad-GFP at 14-ss. (Please note that unlike at 18-ss or later, nokm520mutants do not display apparent phenotypes at 14-ss for easy genotyping. Thus, we decided to infer whether nok mutation affects the OAAs and PAAs at 14-ss by examining over 20 embryos, of which about five embryos were expected to be nokm520 mutants.) C. Sagittal confocal imaging of 22 siblings of nokm520 heterozygous parents confirmed the punctate N-Cad- GFP-positive OAAs (arrowheads) in the midline plane (SM) at 14-ss in all embryos examined. D, E. A TEM image shows the distributions of cell-cell adhesions at the midline region. Cell-cell adhesions assembled cell protrusions in plywood-like clusters (double arrowheads). Two neuroepithelial cells, highlighted with blue and magenta, opposed at their apical ends, which are indicated by the apical marker basal bodies (arrows BB). The lower boxed region in B is magnified in Figure 6D; the upper boxed region is enlarged in C to better illustrate the plywoodlike clustering of cell protrusions that were adhered together by cell-cell adhesions (double arrowheads). |