
Fig. S3
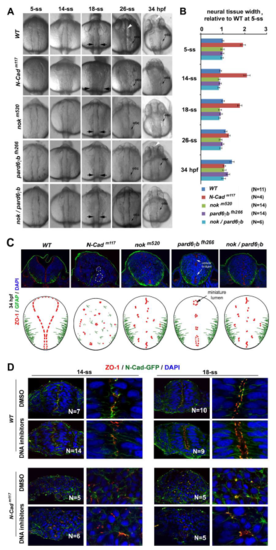
Loss of pioneer protein N-Cad and intermediate proteins Nok and Pard6b prevented neural tube lumen formation and affected the mirror symmetry of the neural tissue A. Dorsal views of the neural tissues of wildtype, N-Cadm117, nokm520, pard6γbfh266, and nokm520/pard6γbfh266 embryos during neurulation. At 26-ss and 34 hpf (hours post-fertilization), the lumen was apparent in wildtype (white arrowhead) but not in mutants. B. Bar graphs illustrate that the neural tissue of N-Cadm117 mutants was 170% to 200% wider than wildtype and other mutants (measured from 5-ss to 18-ss at the otic vesicle regions marked by the opposing black arrows in A; means ± SEM; N numbers, measured embryos). C. At 34 hpf, apical marker ZO-1 localized ectopically in nokm520 single (6 embryos) and nokm520/pard6γbfh266 double mutations (7 embryos), although the basal marker GFAP appeared to localize properly; in pard6γbfh266 (6 embryos), apical marker ZO-1 continued localizing to the midline region and demarcated the boundaries of miniature lumens (black arrow); finally, in N-Cadm117 (20 embryos), the mirror symmetry of the neural tissue remained disrupted at 34 hpf, and cells aggregated into rosettes (two rosettes are marked with dashed lines). The drawings summarize the distributions of the apical and basal markers at 34 hpf. D. Effects of inhibiting cell division with DNA synthesis inhibitors (from 1-ss to 18-ss) on the distribution of apical markers ZO-1 and N-Cad-GPF in wildtype and N-Cadm117 at 18-ss. Note that in wildtype, apical markers localized in a jaggy line at the midline region at 14-ss and then separated into two parallel lines at 18-ss; by contrast, in N-Cadm117, apical markers scattered throughout the tissue at both 14-ss and 18-ss, whether treated with the inhibitors or not. N numbers are numbers of embryos examined for each condition. Left panels are lower magnifications, right panels are higher magnifications. |