
Fig. 4
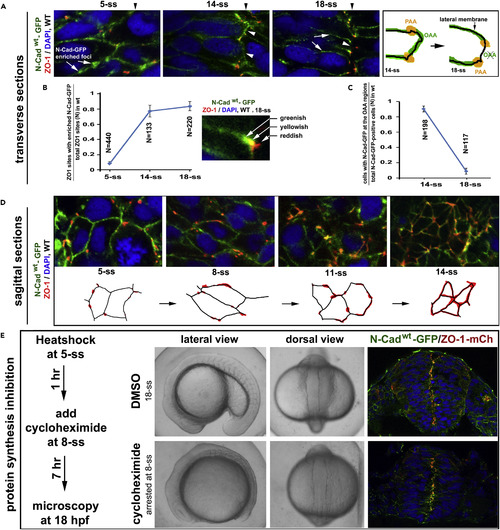
Pioneer Proteins Translocate Apically to Initiate the PAAs and OAAs (A) Dynamic distribution of N-Cadwt-GFP in Tg(HSP70:N-Cadwt-GFP)pt137: at 5-ss, ubiquitously on the cell membrane, with numerous N-Cadwt-GFP-enriched foci; at 14-ss, enriched at the PAAs and on opposing apical surfaces (arrowheads); at 18-ss, enriched at the PAAs and weakly present on the lateral membranes (white arrows), but absent on the opposing apical surfaces (arrowheads; drawings on the right). Black arrowheads indicate the positions of the midline axis. (B) A line graph displays the increase in the ratios between ZO-1 sites that were tightly associated with N-Cadwt-GFP-enriched foci and total ZO-1 sites from 5-ss to 18-ss (8 embryos for each stage; means ± SEM). The inset illustrates the tight association, but not 100% co-localization, between ZO-1 and N-Cadwt-GFP at the PAAs, resulting in greenish, yellowish, and reddish signal appearances. SEM, standard error of the mean. (C) A line graph displays the reduction in the ratios between cells with N-Cadwt-GFP on the opposing apical surfaces and total N-Cadwt-GFP-positive cells from 14-ss to 18-ss (8 embryos for each stage; mean ± SEM). (D) Sagittal imaging revealed that during neural keel-early neural rod transition, ZO-1 signals changed from small punctate sites to circumferential belts (illustrated by drawings). (E) The development of Tg(HSP70:N-Cadwt-GFP)pt137/Tg(HSP70: ZO-1.1-mCherry)pt117b double transgenic embryos was arrested at 8-ss (30 embryos) when treated with protein synthesis inhibitor cycloheximide, but the development proceeded normally to 18-ss (10 embryos) in the 4% DMSO control condition. The scheme illustrates the treatment procedure. In the presence of cycloheximide, N-Cadwt-GFP and ZO-1-mCherry (ZO-1-mCh) still localized to the midline region (compare with N-Cad-GFP and ZO-1 distributions in untreated embryos at 8-ss and 18-ss, Figure S4B). Also see Figure S4. |
| Genes: | |
|---|---|
| Antibody: | |
| Fish: | |
| Conditions: | |
| Anatomical Terms: | |
| Stage Range: | 5-9 somites to 14-19 somites |