
Fig. 5
- ID
- ZDB-FIG-180716-27
- Publication
- Kaur et al., 2018 - let-7 MicroRNA-Mediated Regulation of Shh Signaling and the Gene Regulatory Network Is Essential for Retina Regeneration
- Other Figures
- All Figure Page
- Back to All Figure Page
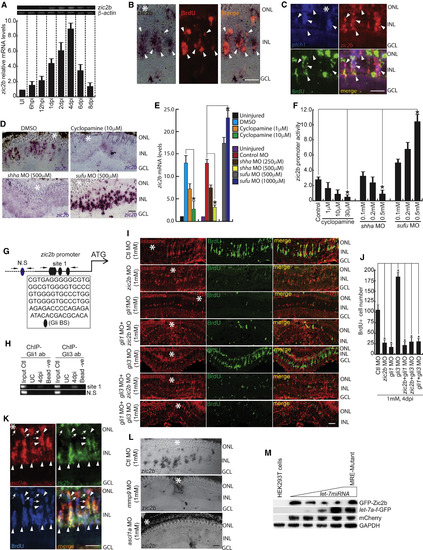
The Shh-Mediated Zic2b Axis Is Necessary during Retina Regeneration (A) RT-PCR (top) and qPCR (bottom) analysis of injury-dependent zic2b expression in the retina; n = 6 biological replicates. (B) ISH and IF microscopy revealed co-localization of zic2b mRNA with BrdU+ MGPCs in 4 dpi retina. (C) FISH and IF microscopy images of a 0.5-μm-thick optical section of retina showing co-localization of zic2b with ptch1 in BrdU+ MGPCs at 4 dpi. (D and E) BF microscopy images of zic2b mRNA ISH in 4 dpi retina, with cyclopamine treatment, MO mediated shha or sufu knockdown done separately (D), which is quantified in (E). (F) Luciferase assay in 24 hpf embryos injected with zic2b:GFP-luciferase vector with cyclopamine treatment and shha or sufu knockdowns. (G) Schematic of the zic2b promoter with a putative Gli-BS. Arrows mark ChIP primers, N.S marks negative control devoid of Gli-BSs, and capital letters mark consensus of Gli-BSs. (H) Retinal ChIP assay at 4 dpi showing both Gli1 and Gli3 bound to the zic2b promoter. (I) IF microscopy images of BrdU+ cells in the regenerating retina with zic2b, gli1, and gli3 knockdowns in isolation or combination, delivered at the time of injury, compared with control MO. (J) BrdU+ cells are quantified in the indicated knockdowns. (K) FISH and IF microscopy images of a 0.5-μm-thick optical section of retina showing co-localization of zic2b with ascl1a in BrdU+ MGPCs at 4 dpi. Arrowheads indicate ascl1a and zic2b co-expression, whereas arrows indicate ascl1a+ but zic2b− cells. (L) ISH microscopy retinal images of zic2b mRNA with mmp9 or ascl1a knockdown at 4 dpi. (M) let-7 microRNA downregulated translation of the GFP construct appended with zic2b harboring microRNA responsive regions in a dose-dependent manner in HEK293T cells. Scale bars represent 10 μm (B, C, and K) and 20 μm (D, I, and L). Asterisk indicates the injury site (B, C, D, I, K, and L). Error bars represent SD. ∗p < 0.001 (E, F, and J). n = 6 biological replicates (E and J); n = 3 (F). See also Figures S4–S7. |
| Genes: | |
|---|---|
| Fish: | |
| Conditions: | |
| Knockdown Reagents: | |
| Anatomical Terms: | |
| Stage: | Adult |
| Fish: | |
|---|---|
| Conditions: | |
| Knockdown Reagents: | |
| Observed In: | |
| Stage: | Adult |