
Fig. S2
- ID
- ZDB-FIG-180716-30
- Publication
- Kaur et al., 2018 - let-7 MicroRNA-Mediated Regulation of Shh Signaling and the Gene Regulatory Network Is Essential for Retina Regeneration
- Other Figures
- All Figure Page
- Back to All Figure Page
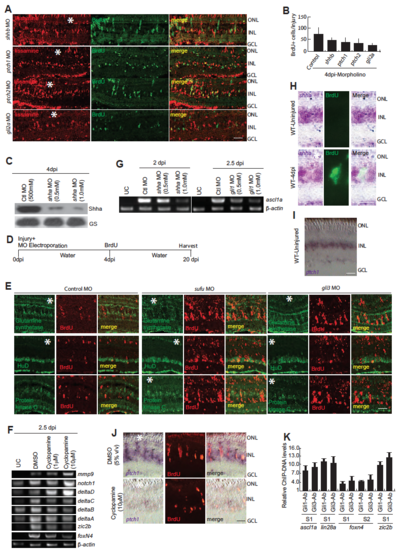
Shh signaling component genes’ knockdowns and lineage tracing of MGPCs in enhanced Shh signaling. (A,B) IF microscopy images of 4dpi retina revealed decline in proliferation marked by reduction in BrdU+ cells in shhb, ptch1, ptch2 and gli2a knockdowns (A), which was quantified in (B). (C) Western blotting assay indicating shha knockdown caused downregulation in the expression of Shha protein. (D,E) The schematic of lineage tracing experiment, wherein control, sufu or gli3 MOs were injected and electroporated while injuring the retina, and an i.p. injection of BrdU was given on 4dpi and eyes were harvested at 20dpi (D), the increased number of BrdU+ cells could make retinal cell types (E). (F) RT-PCR analysis of indicated genes’ mRNA levels in DMSO and cyclopamine treated 2.5dpi retina. (G) RT-PCR analysis of ascl1a mRNA levels in uninjured retina, control knockdown and gli1 knockdown in 2.5dpi retina (H) Bright field (BF) and IF microscopy revealed the expression of shha mRNA and BrdU in uninjured and 4dpi retina. (I,J) ISH and IF of ptch1 and BrdU respectively, in uninjured (I), 4dpi and 4dpi with cyclopamine treatment (J). (K) Relative abundance of ChIP DNA fragments obtained from Gli1 and Gli3 antibodies from various gene promoters, assayed by qPCR, which are normalized to control uninjured retina. Scale bars, 10 μm (A,E,H,I,J). Error bars are SD. |