Fig. S1
- ID
- ZDB-FIG-180716-29
- Publication
- Kaur et al., 2018 - let-7 MicroRNA-Mediated Regulation of Shh Signaling and the Gene Regulatory Network Is Essential for Retina Regeneration
- Other Figures
- All Figure Page
- Back to All Figure Page
|
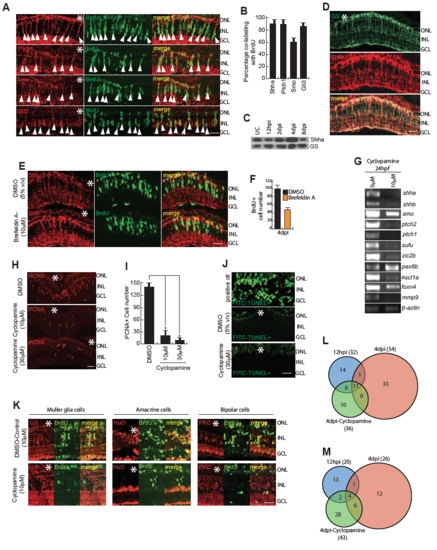
Shh signaling mediated gene expression and lineage tracing of MGPCs in cyclopamine treatment. (A,B) High magnification immunofluorescence microscopy (IF) images of 4dpi retinal sections showed co-localization of Shh signaling components with BrdU+ MGPCs (A), which is quantified in (B). (C) Western blotting assay showed regulation of Shha protein following injury at various time points. (D) IF microscopy images of wild type 4dpi retinal sections revealed significant co-localization of Shha with Glutamine Synthetase (GS), which marks all the Muller glia, at the injury site. (E) IF microscopy of Shha in BrdU+ MGPCs, in 4dpi retina, with Brefeldin A treatment, which is a protein transport inhibitor. (F) BrdU+ cells were quantified in Brefeldin A treatment. (G) RT-PCR analysis of indicated genes mRNA levels in DMSO and cyclopamine treated 24hpf embryos. (H,I) IF microscopy images showed a cyclopamine dose-dependent decline in PCNA+ MGPCs wild-type (H), retinae at 4 dpi, which is quantified in (I) (J) Terminal deoxynucleotidyl transferase (TdT) dUTP Nick-End Labeling (TUNEL) assay done on DNase treated positive control, 4dpi and cyclopamine treated 4dpi retinal sections, showed presence of TUNEL+ cells only in positive control. (K) Cell-fate tracing experiment was done by injuring the fish followed by treating them with 5% (v/v) DMSO or 10μM cyclopamine for first four days followed by an i.p injection of BrdU and then were transferred to water for next 26 days until euthanasia. IF microscopy images of 30dpi retinal sections revealed co-localization of GS, which marks Muller glia, HuD which marks amacrine cells and PKC which marks horizontal cells, with BrdU+ cells in DMSO treated retina but not in cyclopamine treated retina. (L,M) Whole retina RNAseq analysis of DNA binding proteins and transcription factors at 12hpi, 4dpi and 4dpi cyclopamine treatment were compared with uninjured retina showed upregulated genes (L), and downregulated genes (M). Scale bars, 10 μm (A,E,H,J and K) and 20 μm (D). Error bars are SD. |

