
Fig. 7
- ID
- ZDB-FIG-180627-31
- Publication
- Flanagan-Steet et al., 2018 - TGF-ß Regulates Cathepsin Activation during Normal and Pathogenic Development
- Other Figures
- All Figure Page
- Back to All Figure Page
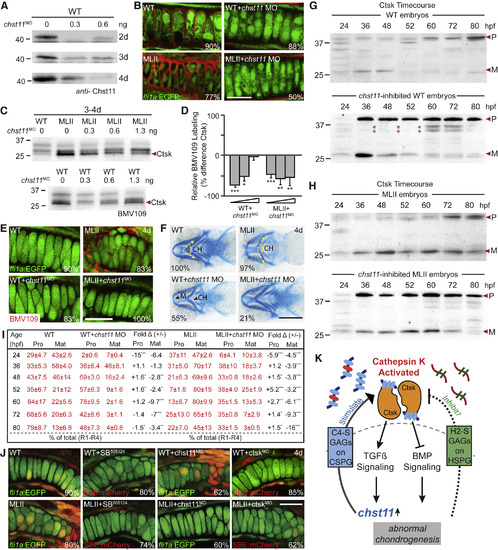
chst11 Inhibition Inhibits Ctsk Processing (A) Immunoblot of Chst11 in MO-inhibited WT embryos 2–4 d. MLII data and quantitation are shown in Figure S6. n = 3 experiments. d, dpf. (B) Immunohistochemistry for C4-S (red) in chst11 MO-inhibited embryos. n = 15–20 embryos per condition from 3 experiments. Percent values are the number of embryos that resemble the picture. Scale bar, 10 μm. (C) Gels of BMV109-labeled chst11-inhibited embryos. n = 4 experiments. (D) Quantitation of the Ctsk band. Error bars, SD; ∗p < 0.05, ∗∗p < 0.01, ∗∗∗p < 0.001. (E) Live confocal analyses of the BMV109 label (red) in chst11-inhibited EGFP-positive chondrocytes. n = 10–15 embryos per condition. Percent values are the number of embryos that resemble the picture. Scale bar, 10 μm. (F) Alcian blue-stained WT, MLII, and chst11-inhibited embryos. n = 100–150 embryos per sample from 3 experiments. Percent values are the number of embryos resembling the picture. Scale bar, 10 μm. (G and H) Immunoblot of Ctsk 24–80 hpf in chst11-inhibited WT (G) and MLII (H) embryos. n = 3 experiments. (I) Table listing the abundance (relative to all Ctsk) of the pro and mature form. (J) Live confocal analyses of cartilage-localized (green) TGF-ß signaling using the SBE:nucCherry reporter. n = 10–15 embryos per condition from 2–3 independent experiments. Percent values are the number of embryos resembling the picture. Scale bar, 10 μm. (K) Schematic of the current model suggesting that TGF-ß-mediated increases in C4-S promote increased activation of extracellular Ctsk in the lysosomal disease MLII. Although not currently known, it is also possible that reduced expression of inhibitory GAGs may contribute. See also Figures S5–S7. |
| Gene: | |
|---|---|
| Antibody: | |
| Fish: | |
| Condition: | |
| Knockdown Reagents: | |
| Anatomical Terms: | |
| Stage: | Day 4 |
| Fish: | |
|---|---|
| Condition: | |
| Knockdown Reagents: | |
| Observed In: | |
| Stage: | Day 4 |